Published: 2025-03-06T03:15:41.000Z
Chart USD/IDR Updates: Under pressure, room to extend pullback from 16590 high

Technical Analyst
1
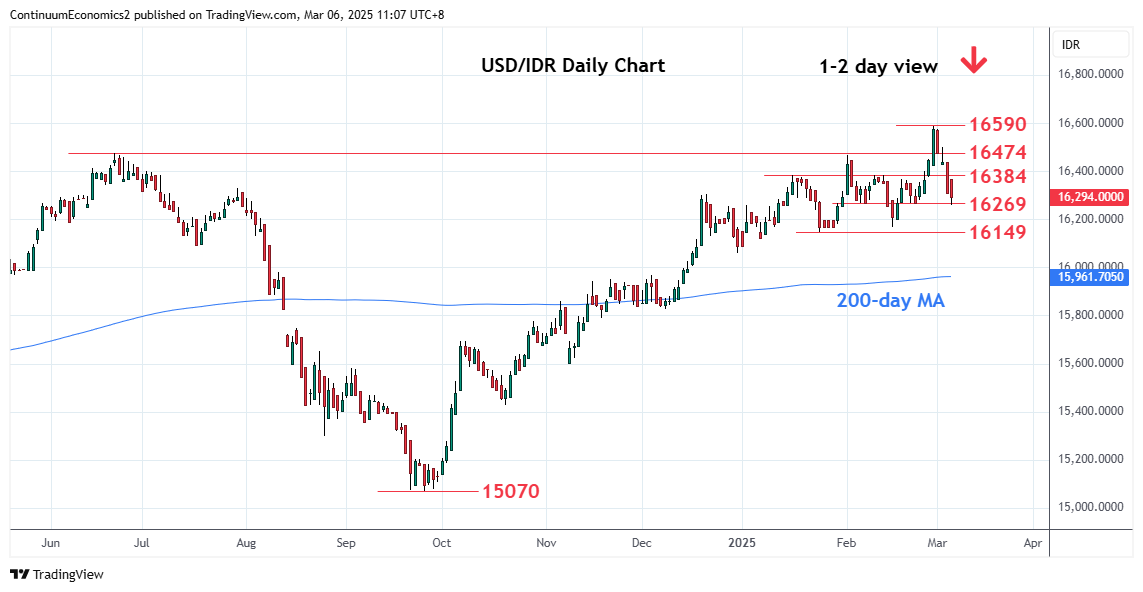
Break of support at the 16400/16384 area extending pullback from the 16590 February YTD high to reach 16269 support
| Levels | Imp | Comment | Levels | Imp | Comment | |||
|---|---|---|---|---|---|---|---|---|
| R4 | 16625 | ** | Mar 2020 year high | S1 | 16269 | * | 24 Feb low | |
| R3 | 16590 | ** | 28 Feb YTD high | S2 | 16169 | ** | 17 Feb low | |
| R2 | 16474 | * | Jun 2024 year high | S3 | 16149 | * | 24 Jan low | |
| R1 | 16384 | * | Jan high | S4 | 16059 | * | 31 Dec low |
Asterisk denotes strength of level
03:10 GMT - Break of support at the 16400/16384 area extending pullback from the 16590 February YTD high to reach 16269 support. Consolidation here see prices unwinding oversold intraday studies but this is expected to give way to fresh selling pressure later. Break will turn focus to strong support at the 16169/16149 higher lows. Below these will open up room for deeper pullback to retrace strong gains from the September low. Meanwhile, resistance is lowered to the 16384 January high which is expected to cap and sustain losses from the 16590 high.