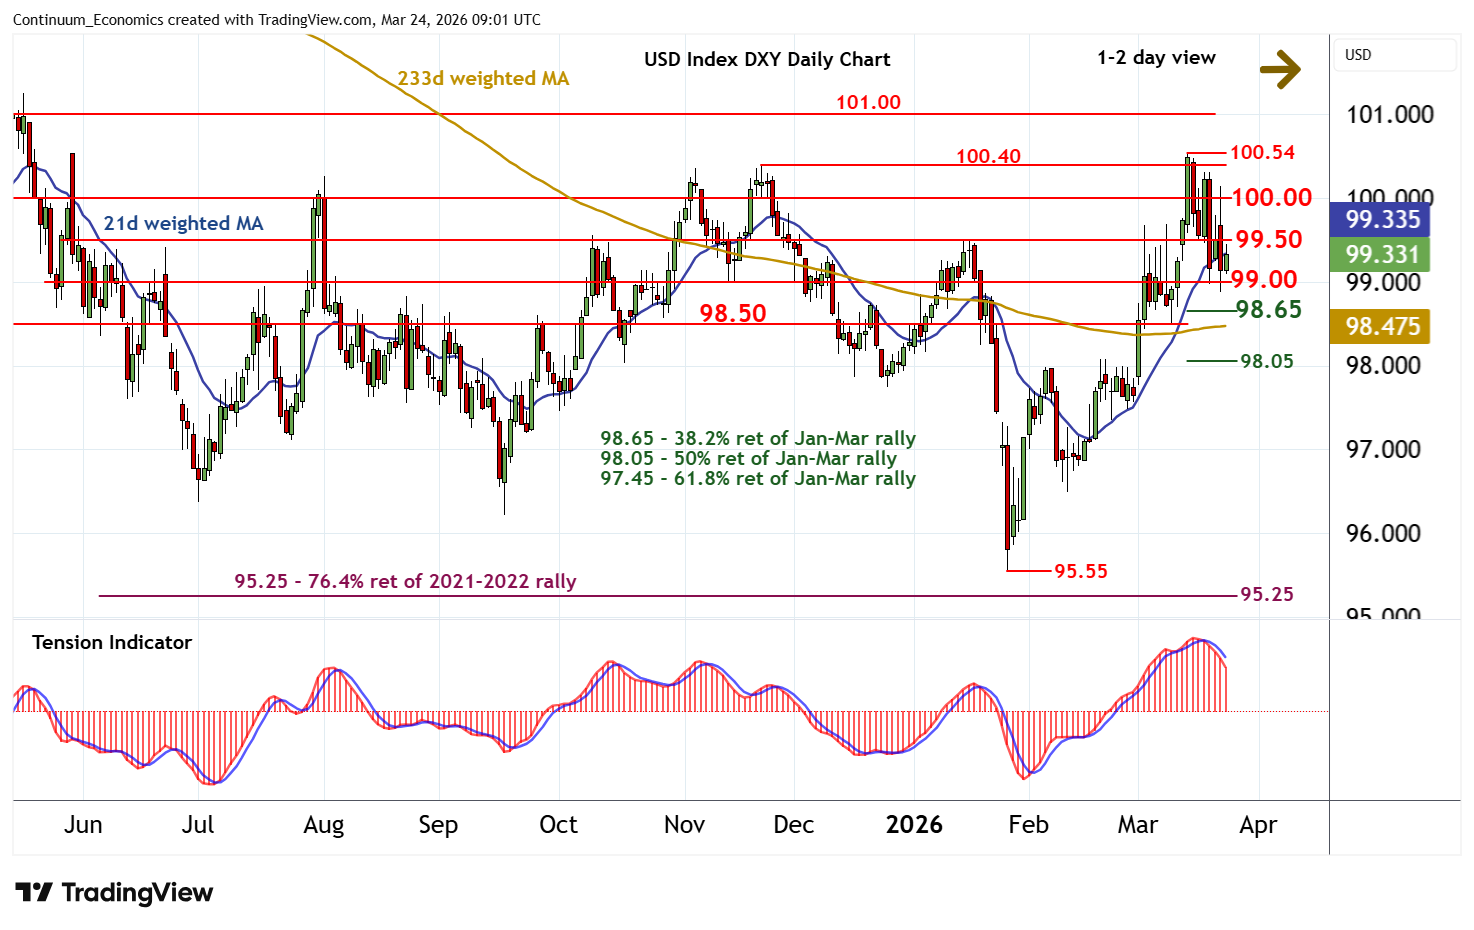
Chart USD Index DXY Update: Choppy trade - support at 98.50/65
The anticipated test above congestion resistance at 100.00 has given way to a sharp pullback to congestion support at 99.00
| Levels | Imp | Comment | Levels | Imp | Comment | |||
|---|---|---|---|---|---|---|---|---|
| R4 | 101.00 | * | congestion | S1 | 99.00 | ** | congestion | |
| R3 | 100.40/54 | ** | 21 Nov (m); 13 Mar YTD highs | S2 | 98.65 | * | 38.2% ret of Jan-Mar rally | |
| R2 | 100.00 | ** | congestion | S3 | 98.50 | * | congestion | |
| R1 | 99.50 | * | congestion | S4 | 98.05 | ** | 50% ret of Jan-Mar rally |
Asterisk denotes strength of level
08:50 GMT - The anticipated test above congestion resistance at 100.00 has given way to a sharp pullback to congestion support at 99.00, with prices currently balanced in choppy trade around 99.35. Daily readings are under pressure, highlighting room for a fresh test below 99.00. But already oversold daily stochastics and rising weekly charts should limit initial scope in short-covering/consolidation within support at congestion around 98.50 and the 98.65 Fibonacci retracement. Meanwhile, resistance is lowered to 99.50. Any immediate tests above here should meet renewed selling interest beneath 100.00.