Chart GBP/USD Update: Extending range trade

The test above congestion resistance at 1.2700 has been pushed back from 1.2715
| Level | Comment | Level | Comment | |||||
|---|---|---|---|---|---|---|---|---|
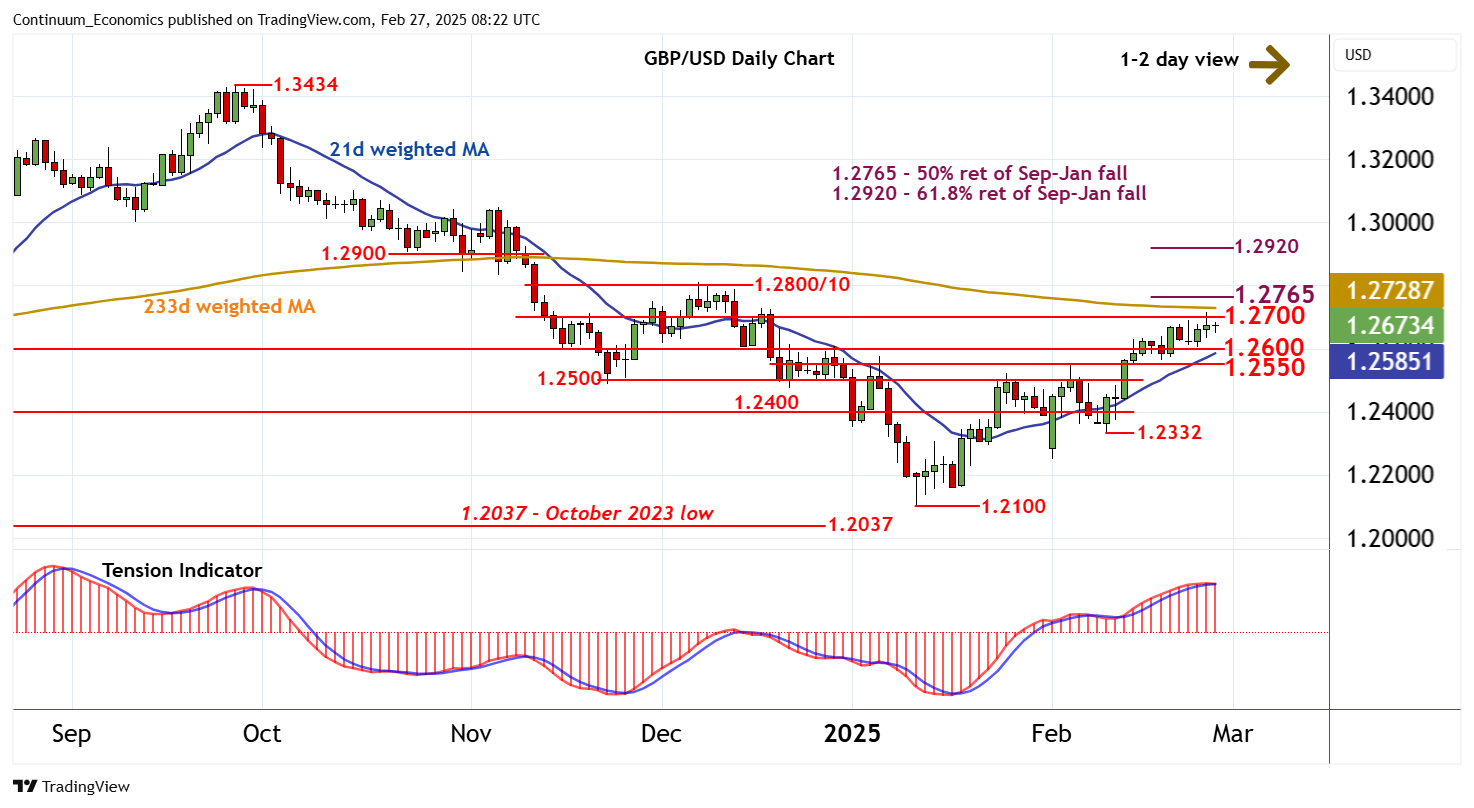
| R4 | 1.2900 | * | break level | S1 | 1.2600 | * | congestion | |
| R3 | 1.2800/10 | ** | congestion; 6 Dec (m) high | S2 | 1.2550 | * | break level | |
| R2 | 1.2765 | ** | 50% ret of Sep-Jan fall | S3 | 1.2500 | * | break level | |
| R1 | 1.2700/15 | * | congestion; 26 Feb high | S4 | 1.2450 | break level |
Asterisk denotes strength of level
08:10 GMT - The test above congestion resistance at 1.2700 has been pushed back from 1.2715, as intraday studies turn mixed and the positive daily Tension Indicator flattens, with prices currently trading around 1.2675. Daily stochastics continue to edge higher, however, and broader weekly charts are positive, pointing to room for further gains in the coming sessions. A close above 1.2700 is needed to turn sentiment positive and extend January gains initially towards the 1.2765 Fibonacci retracement. Meanwhile, support remains down to congestion around 1.2600. A break beneath here, if seen, will open up 1.2550, where fresh buying interest is expected to appear.