Published: 2026-01-30T08:06:44.000Z
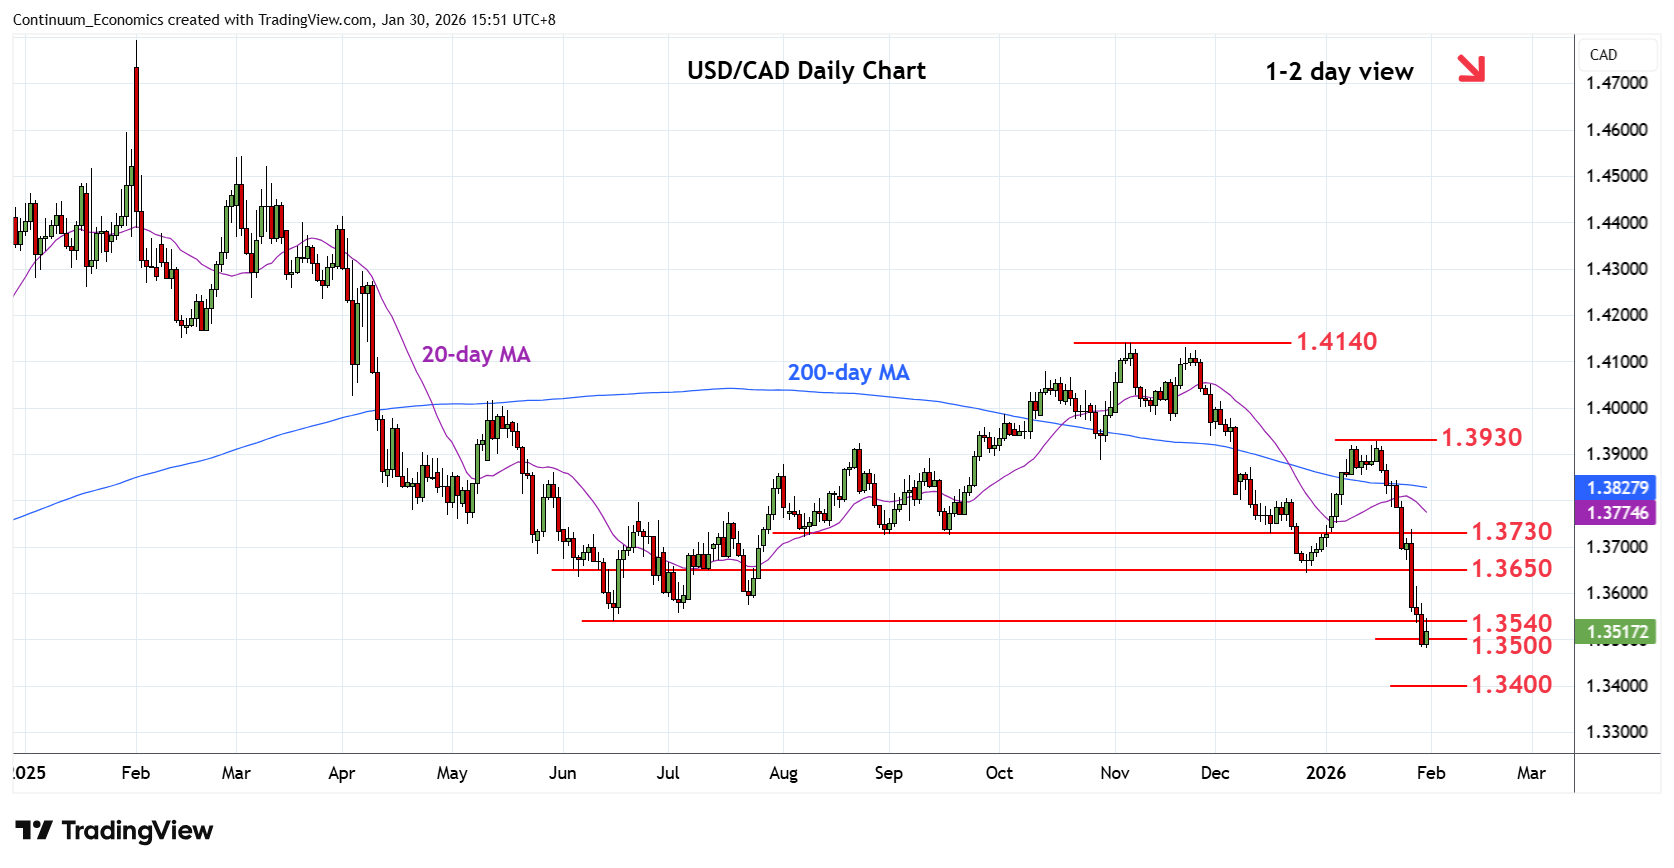
Chart USD/CAD Update: Consolidating at 1.3500, but still heavy
-
Slipped to fresh low at 1.3481 ahead of bounce to consolidate at the 1.3500 level
| Levels | Imp | Comment | Levels | Imp | Comment | |||
|---|---|---|---|---|---|---|---|---|
| R4 | 1.3700/25 | * | congestion, Aug/Sep lows | S1 | 1.3481 | intraday low | ||
| R3 | 1.3640/50 | ** | Dec low, congestion | S2 | 1.3420/00 | * | Sep 2024 low, 50% | |
| R2 | 1.3600 | * | congestion | S3 | 1.3350 | * | congestion | |
| R1 | 1.3540 | * | Jun 2025 year low | S4 | 1.3300 | * | congestion |
Asterisk denotes strength of level
07:50 GMT - Slipped to fresh low at 1.3481 ahead of bounce to consolidate at the 1.3500 level. Daily studies are stretched but corrective bounce likely to be limited with resistance at the 1.3540, June 2025 year low, expected to cap. Only above this will open up room for stronger corrective bounce to the 1.3600 level and strong resistance at 1.3640/50 area. Consolidation expected to give way to renewed selling pressure later to further extend losses from the February 2025 year high. Lower will see extension to the 1.3420/00 support and 50% Fibonacci level.