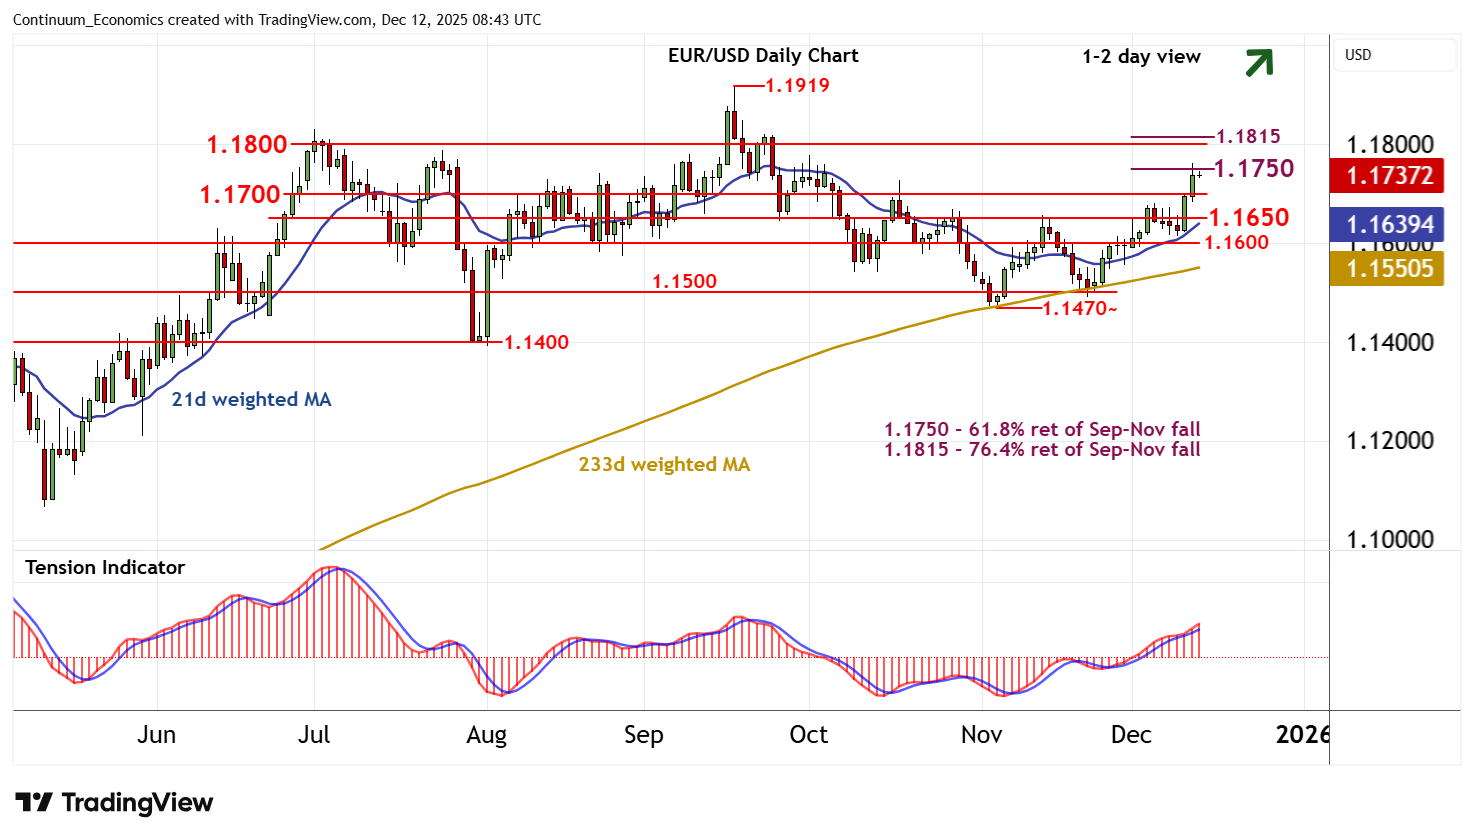
Chart EUR/USD Update: Consolidating test of the 1.1750 Fibonacci retracement
Anticipated gains have reached resistance at the 1.1750 Fibonacci retracement
| Levels | Imp | Comment | Levels | Imp | Comment | |||
|---|---|---|---|---|---|---|---|---|
| R4 | 1.1919 | ** | 17 Sep YTD high | S1 | 1.1700 | * | congestion | |
| R3 | 1.1815 | ** | 76.4% ret of Sep-Nov fall | S2 | 1.1650 | * | congestion | |
| R2 | 1.1800 | * | congestion | S3 | 1.1600 | * | congestion | |
| R1 | 1.1750 | ** | 61.8% ret of Sep-Nov fall | S4 | 1.1550 | * | break level |
*Asterisk denotes strength of level
08:30 GMT - Anticipated gains have reached resistance at the 1.1750 Fibonacci retracement, with prices extending to 1.1763 before settling into consolidation beneath 1.1750. Overbought intraday studies are unwinding, suggesting room for a minor pullback. But rising daily readings and positive weekly charts should limit scope in renewed buying interest towards congestion support at 1.1700. Following cautious/corrective trade, fresh gains are looked for. A close above 1.1750 would improve sentiment and extend November gains towards 1.1800/15, where already overbought daily stochastics could prompt profit-taking/consolidation. Meanwhile, a close below 1.1700 would turn sentiment neutral and prompt further consolidation above 1.1650.