Chart AUD/USD Update: Sharp pullback from fresh year high
The anticipated break above strong resistance at the 0.7155~ year high of February 2023 has posted a fresh year high around 0.7185
| Levels | Imp | Comment | Levels | Imp | Comment | |||
|---|---|---|---|---|---|---|---|---|
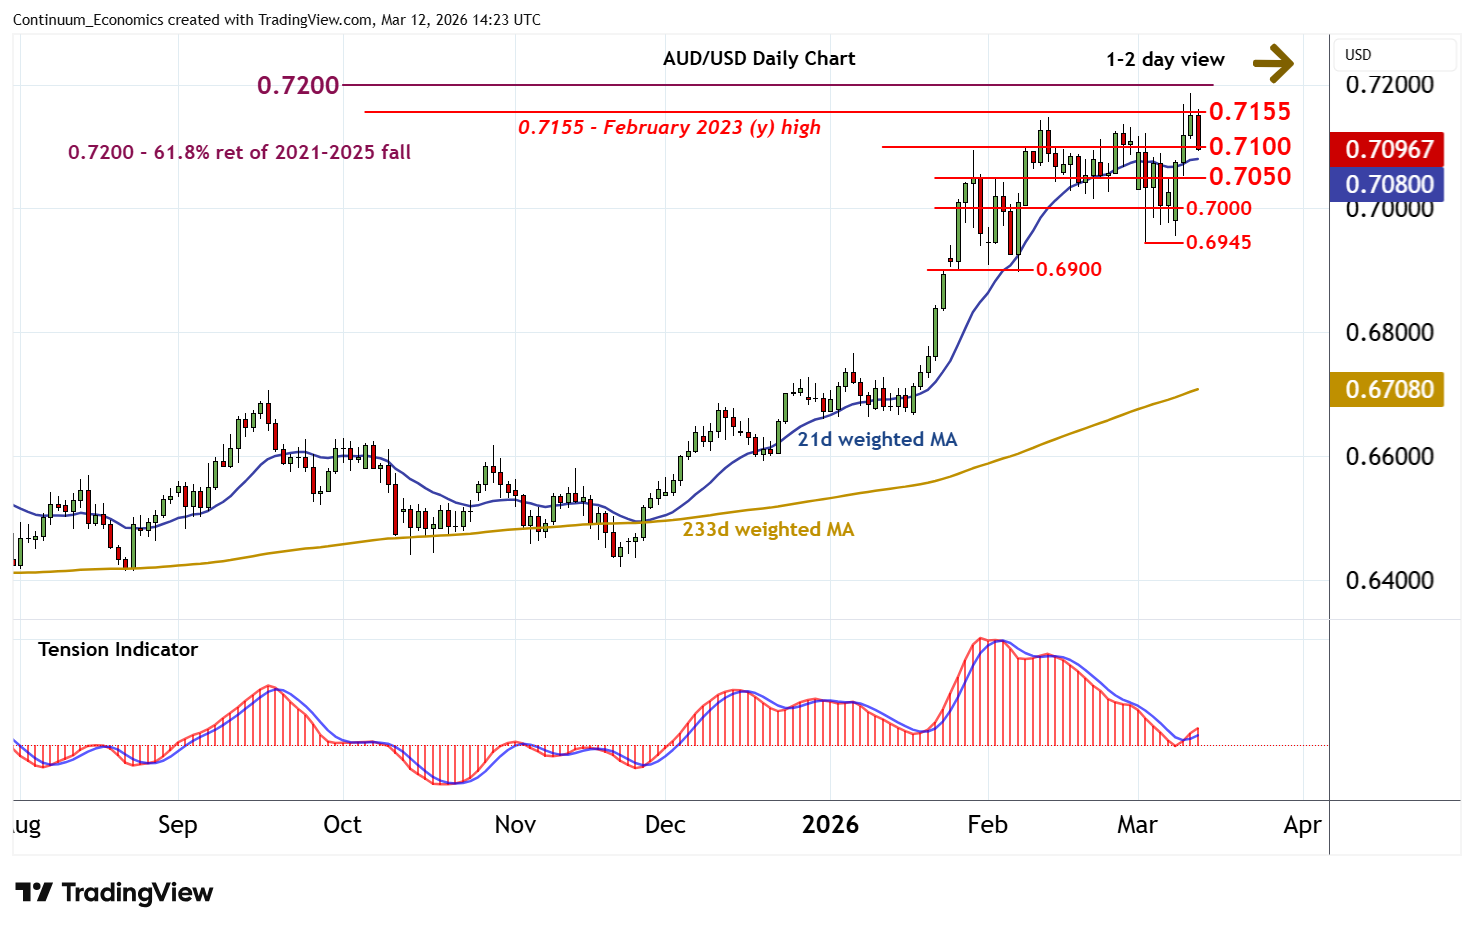
| R4 | 0.7280~ | ** | June 2022 high | S1 | 0.7100 | break level | ||
| R3 | 0.7200 | ** | 61.8% ret of 2021-2025 fall | S2 | 0.7050 | * | congestion | |
| R2 | 0.7185~ | * | 11 Mar YTD high | S3 | 0.7000 | * | congestion | |
| R1 | 0.7155~ | ** | Feb 2023 (y) high | S4 | 0.6900 | ** | break level |
Asterisk denotes strength of level
14:00 GMT - The anticipated break above strong resistance at the 0.7155~ year high of February 2023 has posted a fresh year high around 0.7185, before turning lower in steady selling interest to pressure support at 0.7100. Negative intraday studies and flattening positive daily readings highlight room for a break beneath here towards congestion support at 0.7050. Negative weekly charts, however, suggest potential for still deeper losses towards 0.7000. Meanwhile, resistance remains strong at 0.7155~ and extends to the 0.7200 multi-year Fibonacci retracement. This broad range should cap any immediate retests higher.