Published: 2026-05-11T07:15:43.000Z
Chart EUR/AUD Update: Consolidating above 1.6200
-
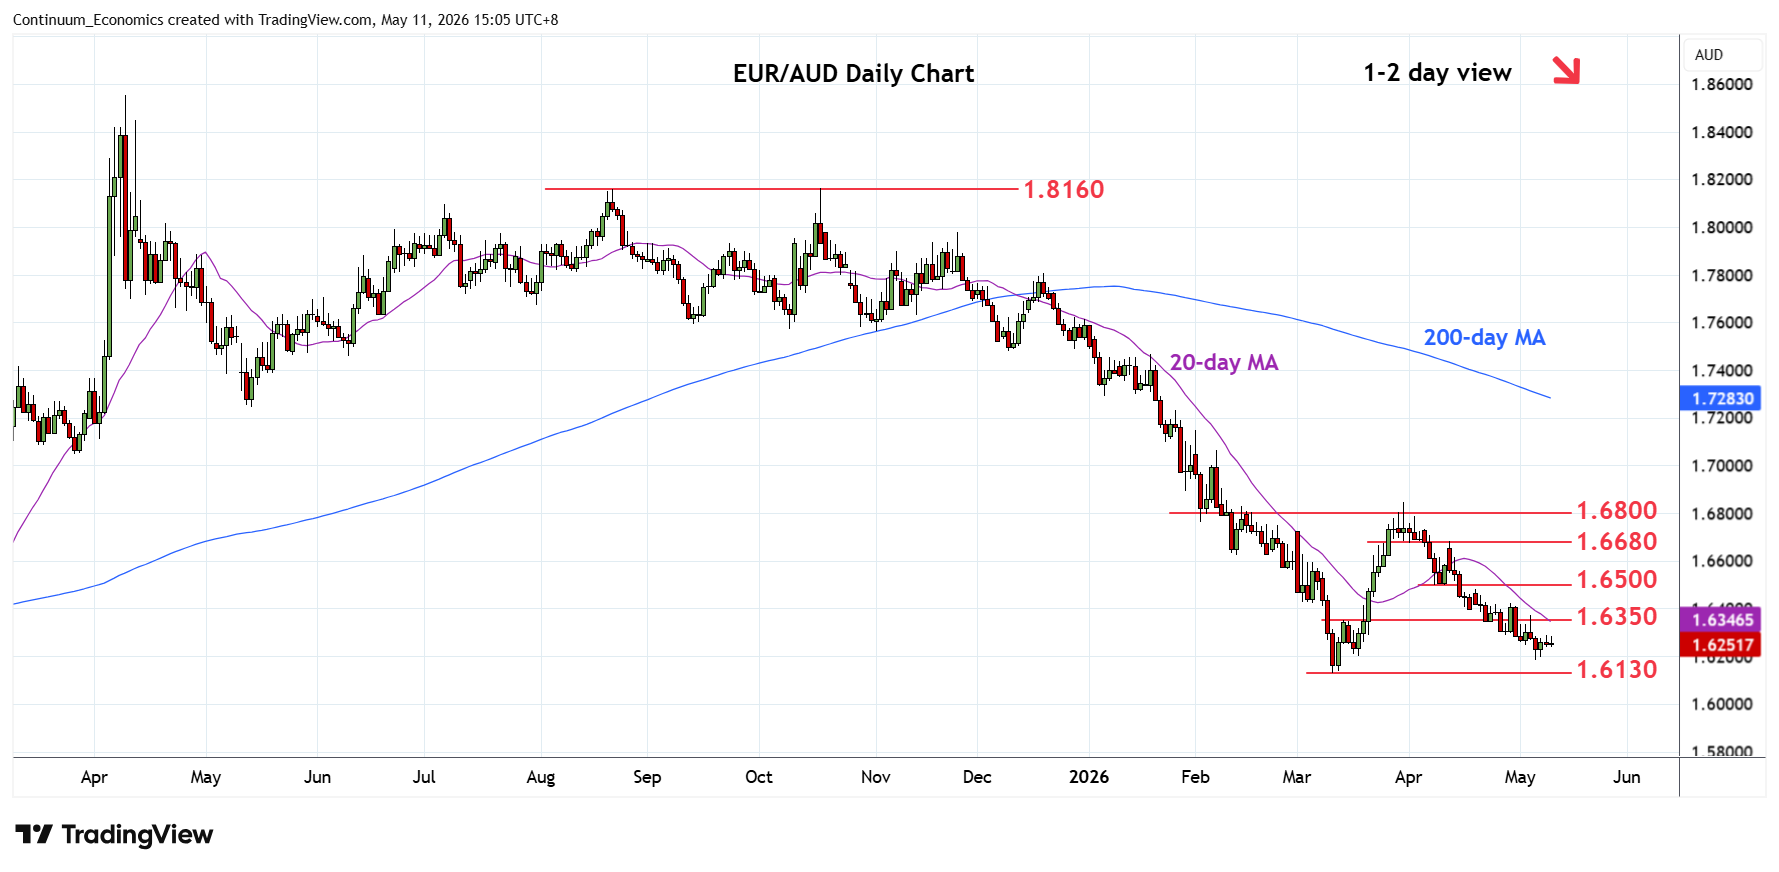
Edged up from the 1.6200 level as prices consolidate losses from the 1.6845 March high
| Levels | Imp | Comment | Levels | Imp | Comment | |||
|---|---|---|---|---|---|---|---|---|
| R4 | 1.6600/20 | * | congestion | S1 | 1.6200 | * | 18 Mar low | |
| R3 | 1.6500 | ** | congestion, 8 Apr low | S2 | 1.6130 | ** | 11 Mar YTD low | |
| R2 | 1.6400/25 | * | congestion, 5 Mar low | S3 | 1.6000 | ** | figure, congestion | |
| R1 | 1.6350 | * | congestion, 13 Mar high | S4 | 1.5960 | ** | 2024 year low |
Asterisk denotes strength of level
07:10 GMT - Edged up from the 1.6200 level as prices consolidate losses from the 1.6845 March high. Oversold daily studies caution corrective bounce but gains are expected to be limited with resistance at 1.6350 and extending to the 1.6400/25 area expected to cap and give way to renewed selling pressure later. Below the 1.6200 level and 1.6130 low will further retrace the 2022/2025 rally and see room for extension to target the 1.6000 figure. Lower still, will open up room for extension to 1.5960 the 2024 year low and 1.5915, 61.8% Fibonacci retracement.