Continuum Economics
  • Search
  • About Us
  • Buy
  • Invite A Friend
  • My Basket
  • Articles
  • Calendar
  • Forecasts
  • Events
  • Data
  • Newsletters
  • My Alerts
  • Community
  • Directory
  • About Us
  • Buy
  • Invite A Friend
  • My Basket
  • Articles
    • All
    • Thematic
    • Tactical
    • Asia
    • EMEA
    • Americas
    • Newsletters
    • Freemium
    • Editor's Choice
    • Most Viewed
    • Most Shared
    • Most Liked
  • Calendar
    • Interactive
      • China
      • United States
      • Eurozone
      • United Kingdom
    • Month Ahead
    • Reviews
    • Previews
  • Forecasts
    • Forecasts
    • Key Views
  • Events
    • Media
    • Conference Calls
  • Data
    • Country Insights
    • Shadow Credit Ratings
    • Full CI Data Download
  • Newsletters
  • My Alerts
  • Community
    • FX
    • Fixed Income
    • Macro Strategy
    • Credit Markets
    • Equities
    • Commodities
    • Precious Metals
    • Renewables
  • Directory
  • My Account
  • Notifications Setup
  • Administration Panel
  • Account Details
  • Recent Devices
  • Distribution Lists
  • Shared Free Trials
  • Saved Articles
  • Shared Alerts
  • My Posts
Back
Published: 2026-03-23T09:46:02.000Z

Chartbook: Chart USD/CHF: Room for corrective gains in the coming weeks

-

Anticipated losses have extended the January 2025 bear trend to post a fresh 2026 year low at 0.7600.

Anticipated losses have extended the January 2025 bear trend to post a fresh 2026 year low at 0.7600.

Subsequent consolidation above here has given way to a bounce, as weekly stochastics rise and the weekly Tension Indicator improves, with prices currently trading around 0.7875.

In the coming weeks, further gains are looked for, with multi-month congestion within the broad 0.8000 - 0.8100 range to attract.

A close above here will open up the 0.8220 multi-month Fibonacci retracement. But by-then overbought weekly stochastics could limit any initial tests in profit-taking/consolidation.

Meanwhile, support is at the 0.7600 current year low of 28 January.

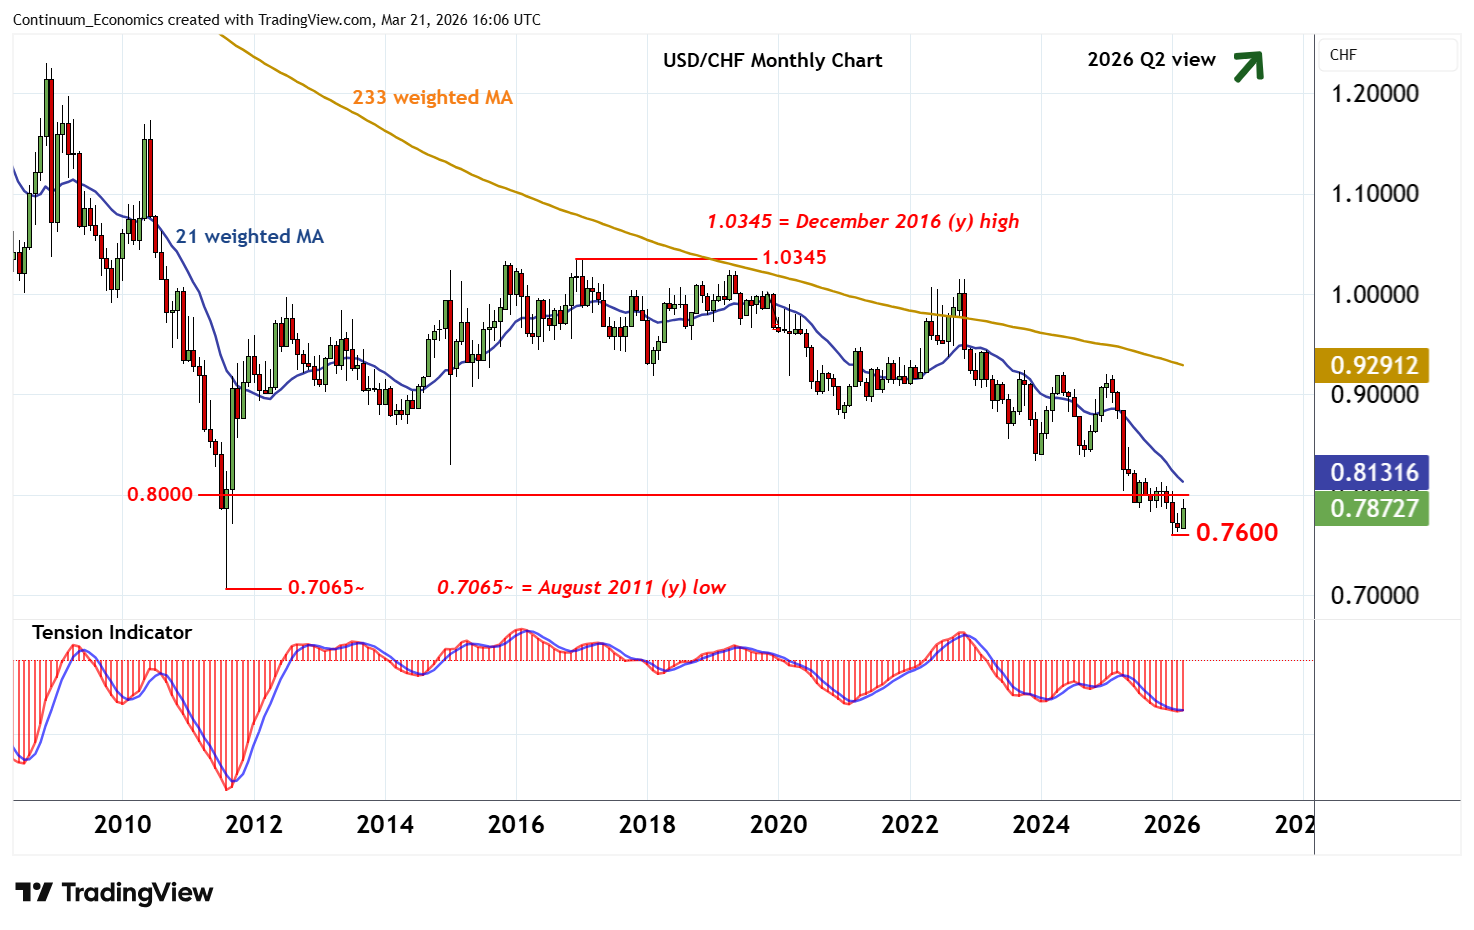
A tick higher in oversold monthly stochastics and the flattening negative monthly Tension Indicator should limit any immediate pullback in consolidation above here.

But from a broader multi-month perspective, the current choppy bounce is viewed as corrective, as multi-month stochastics and the multi-month Tension Indicator continue to fall.

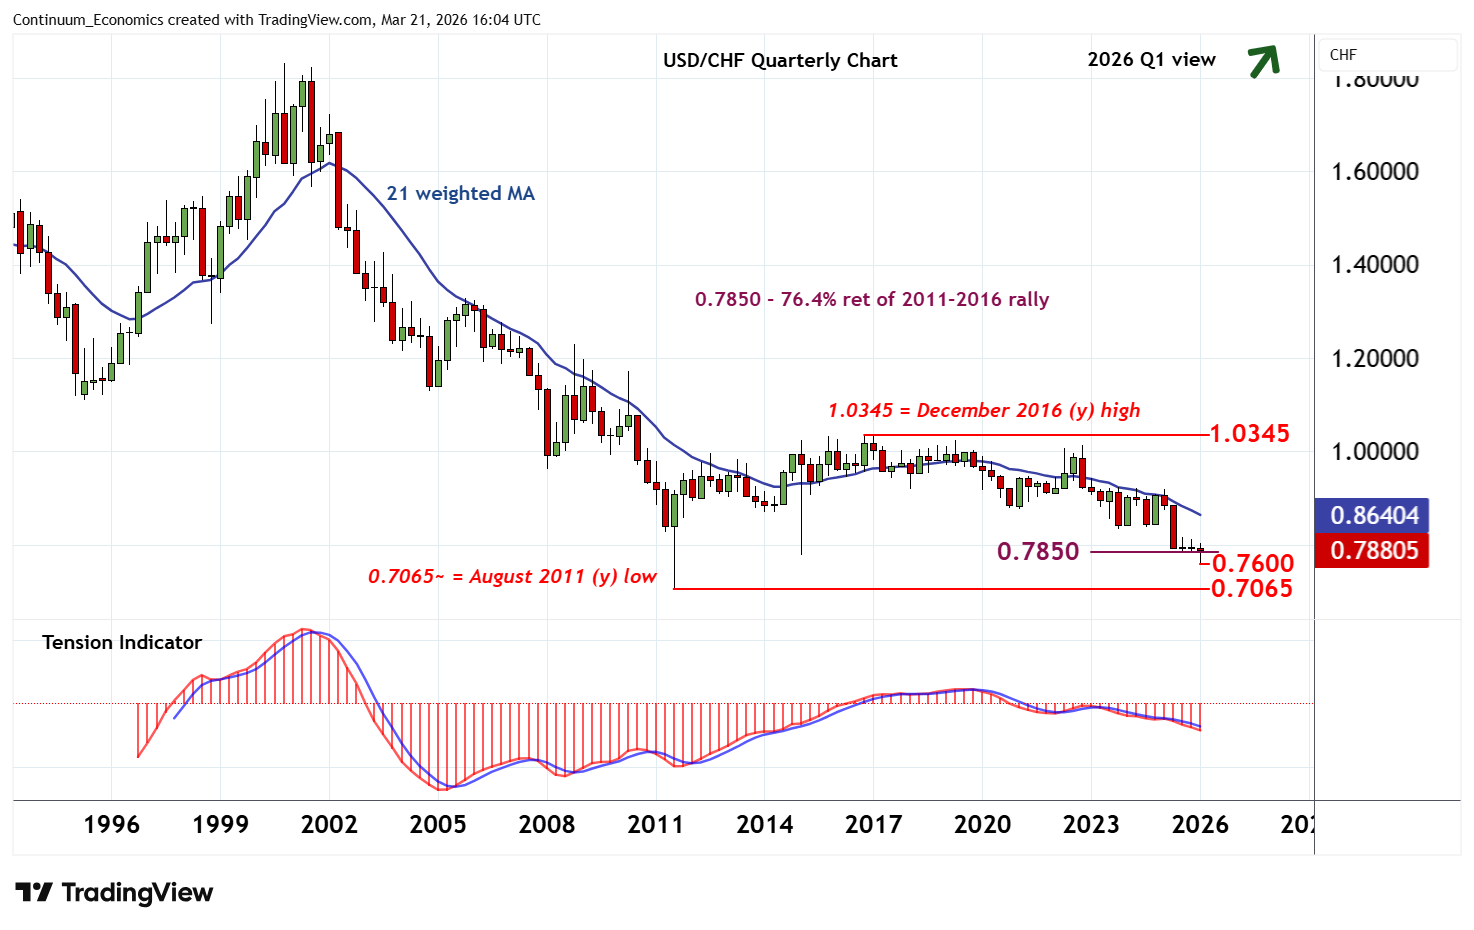
A later break below 0.7600 will confirm continuation of December 2016 losses and open up critical support at the 0.7065 year low of August 2011.

Continue to read the article for free
Login

or

or

Topics
USD/CHF-TA
Technical Analysis
ChartBook

GENERAL

  • Home
  • About Us
  • Our Team
  • Careers

LEGAL

  • Terms and Conditions
  • Privacy Policy
  • Compliance
  • GDPR

GET IN TOUCH

  • Contact Us
Continuum Economics
The Technical Analyst Awards Winner 2021
The Technical Analyst Awards Finalist 2020

© 2026 Continuum Economics

image