Chart GBP/USD Update: Choppy trade - studies under pressure
The opening gap below 1.3500 has bounced from 1.3475
| Level | Comment | Level | Comment | |||||
|---|---|---|---|---|---|---|---|---|
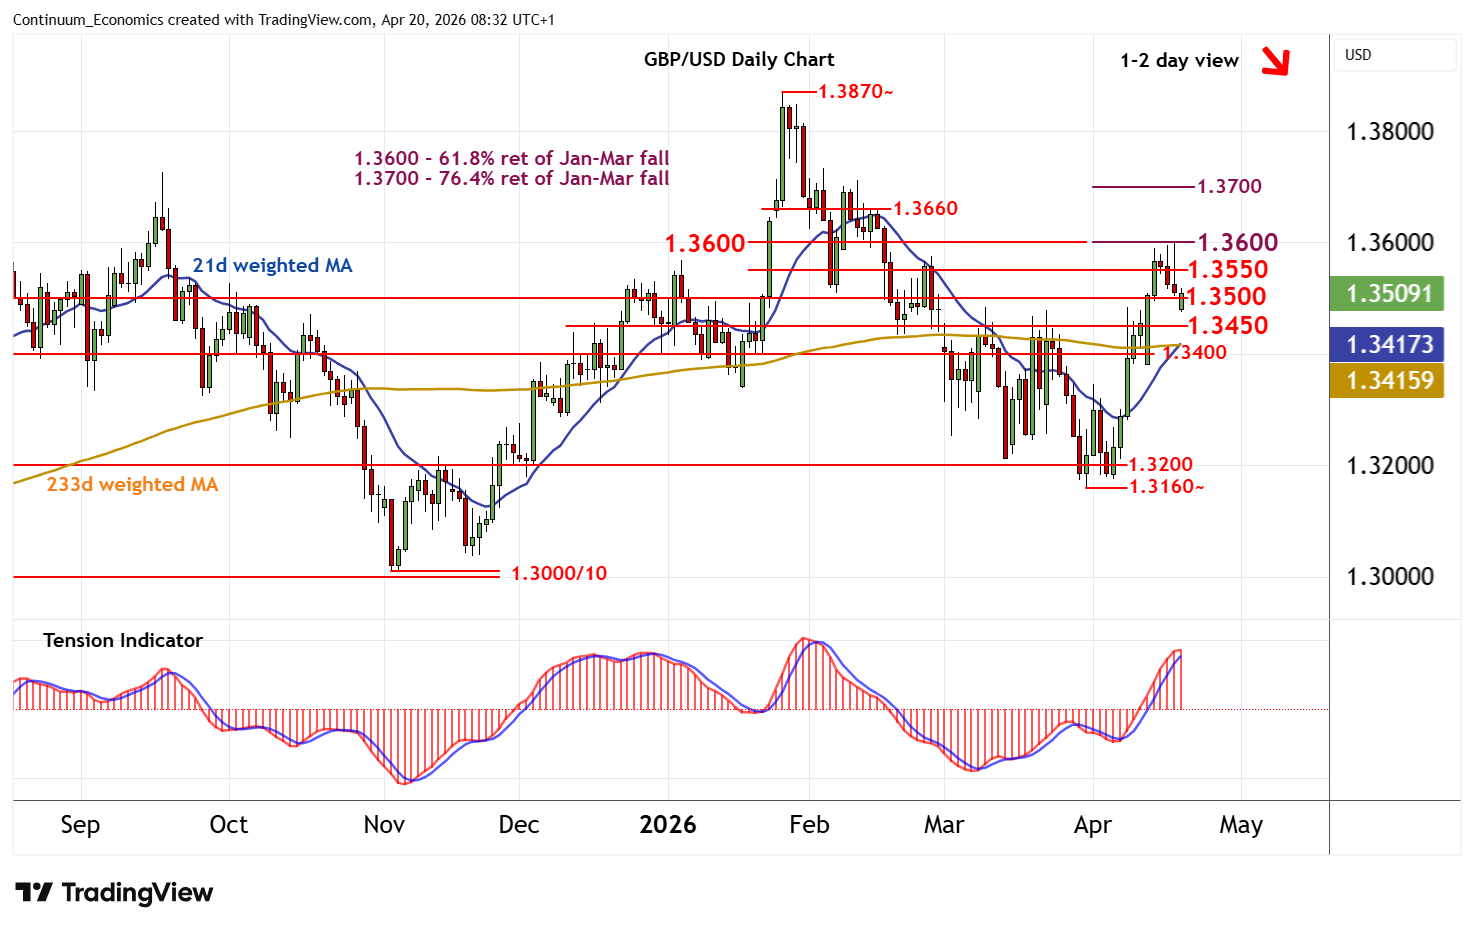
| R4 | 1.3700 | ** | 76.4% ret of Jan-Mar fall | S1 | 1.3500 | ** | congestion | |
| R3 | 1.3660 | * | congestion | S2 | 1.3450 | break level | ||
| R2 | 1.3600 | ** | congestion; 61.8% ret | S3 | 1.3400 | ** | congestion | |
| R1 | 1.3550 | * | congestion | S4 | 1.3350 | * | congestion |
Asterisk denotes strength of level
08:10 BST - The opening gap below 1.3500 has bounced from 1.3475, as oversold intraday studies flatten, with prices currently trading around 1.3515. Overbought daily stochastics are turning down and the positive daily Tension Indicator is also coming under pressure, highlighting room for a fresh test beneath here. A break will open up 1.3450. But rising weekly charts should limit any deeper losses in renewed buying interest towards congestion around 1.3400. Meanwhile, resistance remains at congestion around 1.3550. But a close above stronger resistance at 1.3600 is needed to turn sentiment positive once again and extend late-March gains towards congestion around 1.3660. Stronger resistance at the 1.3700 Fibonacci retracement should prompt more significant profit-taking.