Published: 2026-01-07T01:20:23.000Z
Chart EUR/USD Update: Leaning lower from December high
1
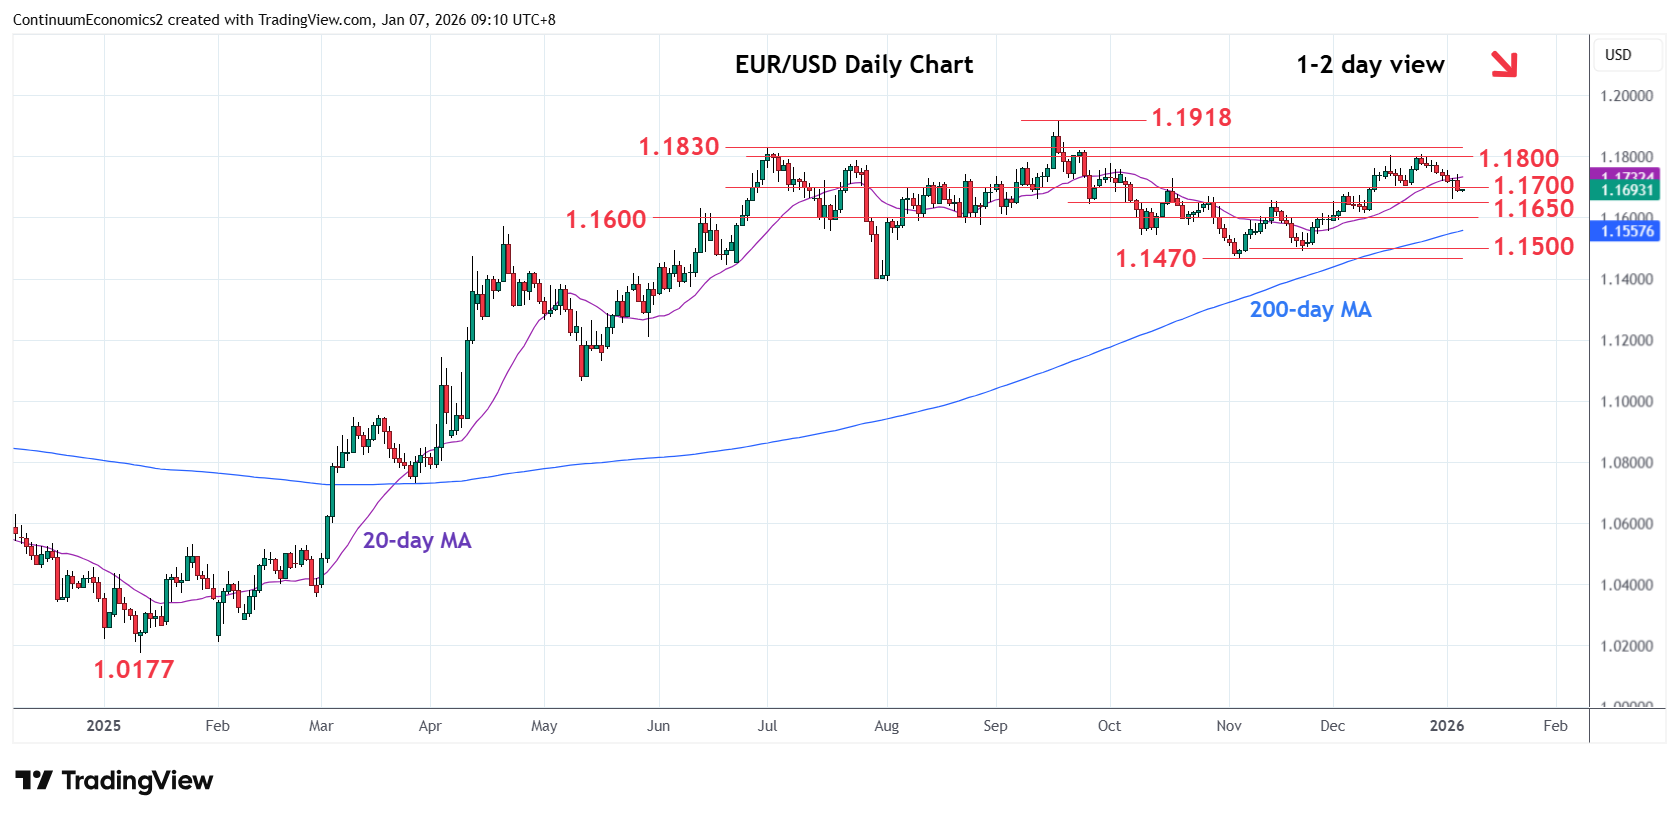
Pressure remains on the downside as prices extend pullback from the December high to pressure support at the 1.1700/1.1682 area
| Levels | Imp | Comment | Levels | Imp | Comment | |||
|---|---|---|---|---|---|---|---|---|
| R4 | 1.1918 | ** | 17 Sep 2025 year high | S1 | 1.1682 | * | 4 Dec high | |
| 14 | 1.1900 | * | figure | S2 | 1.1650 | ** | congestion | |
| R2 | 1.1800/30 | ** | congestion, Jul high | S3 | 1.1615/00 | ** | 9 Dec low, congestion | |
| R1 | 1.1750 | * | congestion | S4 | 1.1550 | * | congestion |
Asterisk denotes strength of level
01:20 GMT - Pressure remains on the downside as prices extend pullback from the December high to pressure support at the 1.1700/1.1682 area. Negative daily studies keep pressure on the downside and suggest room for deeper pullback to retrace gains from the November low. Lower will see room to support at the 1.1650/1.1600 congestion area which is expected to underpin. Meanwhile, resistance is lower to the 1.1750 congestion. Regaining this will expose the 1.1800 December high to retest and further extend the November gains.