Published: 2025-02-20T09:10:46.000Z
Chart USD/CHF Update: Turning away from 0.9050

Senior Technical Strategist
1
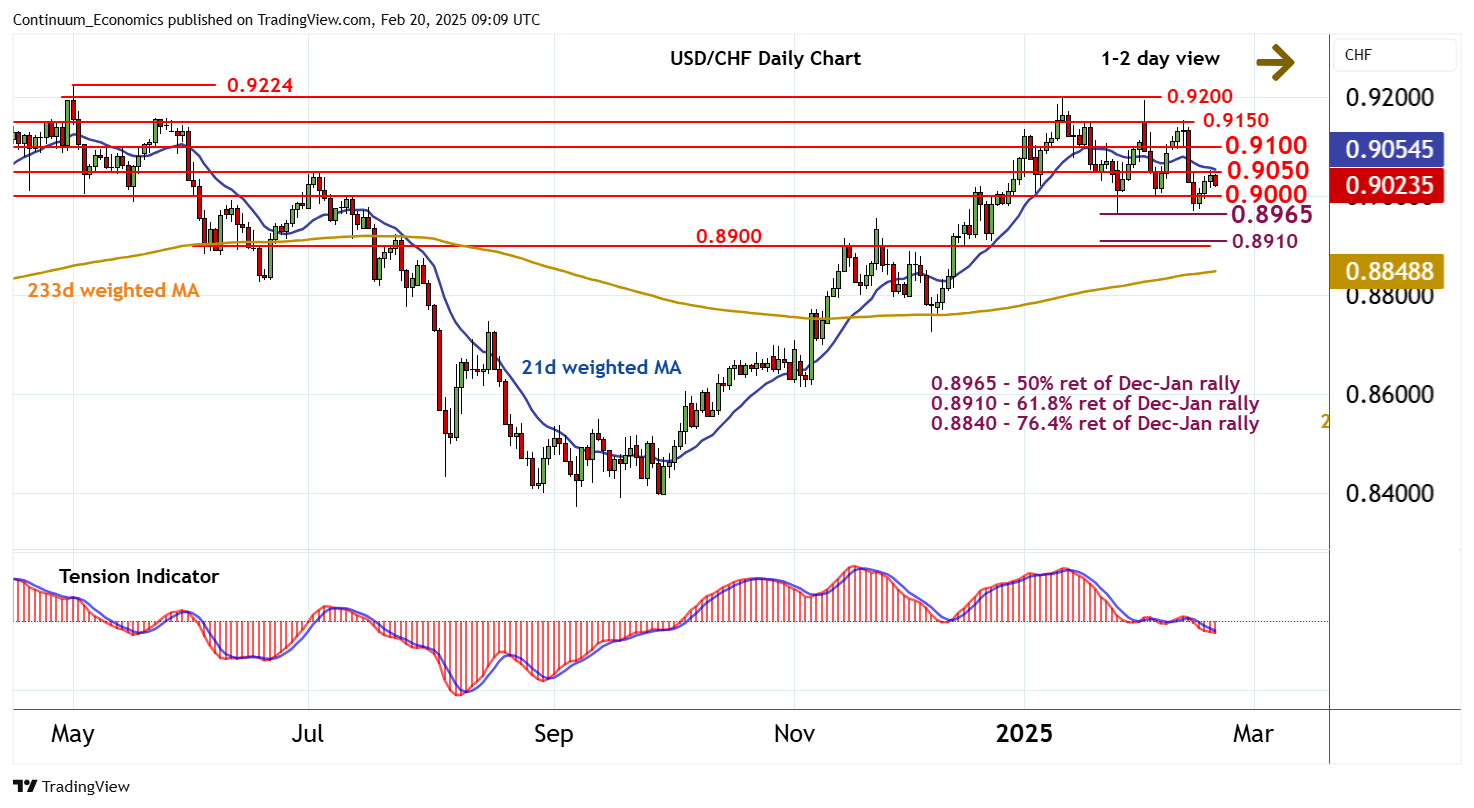
The test of congestion resistance at 0.9050 has given way to a pullback
| Level | Comment | Level | Comment | |||||
|---|---|---|---|---|---|---|---|---|
| R4 | 0.9200 | ** | break level, 13 Jan YTD high | S1 | 0.9000 | ** | congestion | |
| R3 | 0.9150 | * | congestion tops | S2 | 0.8965 | ** | 50% ret, 27 Jan YTD low | |
| R2 | 0.9100 | ** | break level | S3 | 0.8900/10 | ** | break level; 61.8% ret | |
| R1 | 0.9050 | * | congestion | S4 | 0.8840 | ** | 76.4% ret of Dec-Jan rally |
Asterisk denotes strength of level
09:00 GMT - The test of congestion resistance at 0.9050 has given way to a pullback, as overbought intraday studies unwind, with prices currently trading around 0.9025. Focus is turning to congestion support at 0.9000, but rising daily stochastics and the flat bearish daily Tension Indicator are expected to limit any immediate break in renewed consolidation above strong support at 0.8965. Negative weekly charts, however, suggest room for a later break beneath here and continuation of January losses towards strong support at 0.8900/10. Meanwhile, a close above 0.9050, if seen, should be capped by 0.9100.