Published: 2026-03-09T00:31:02.000Z
Chart AUD/USD Update: Under pressure
1
Gapped down at the opening below the .7000 level see prices extending losses to retest the .6945 low of 3 March
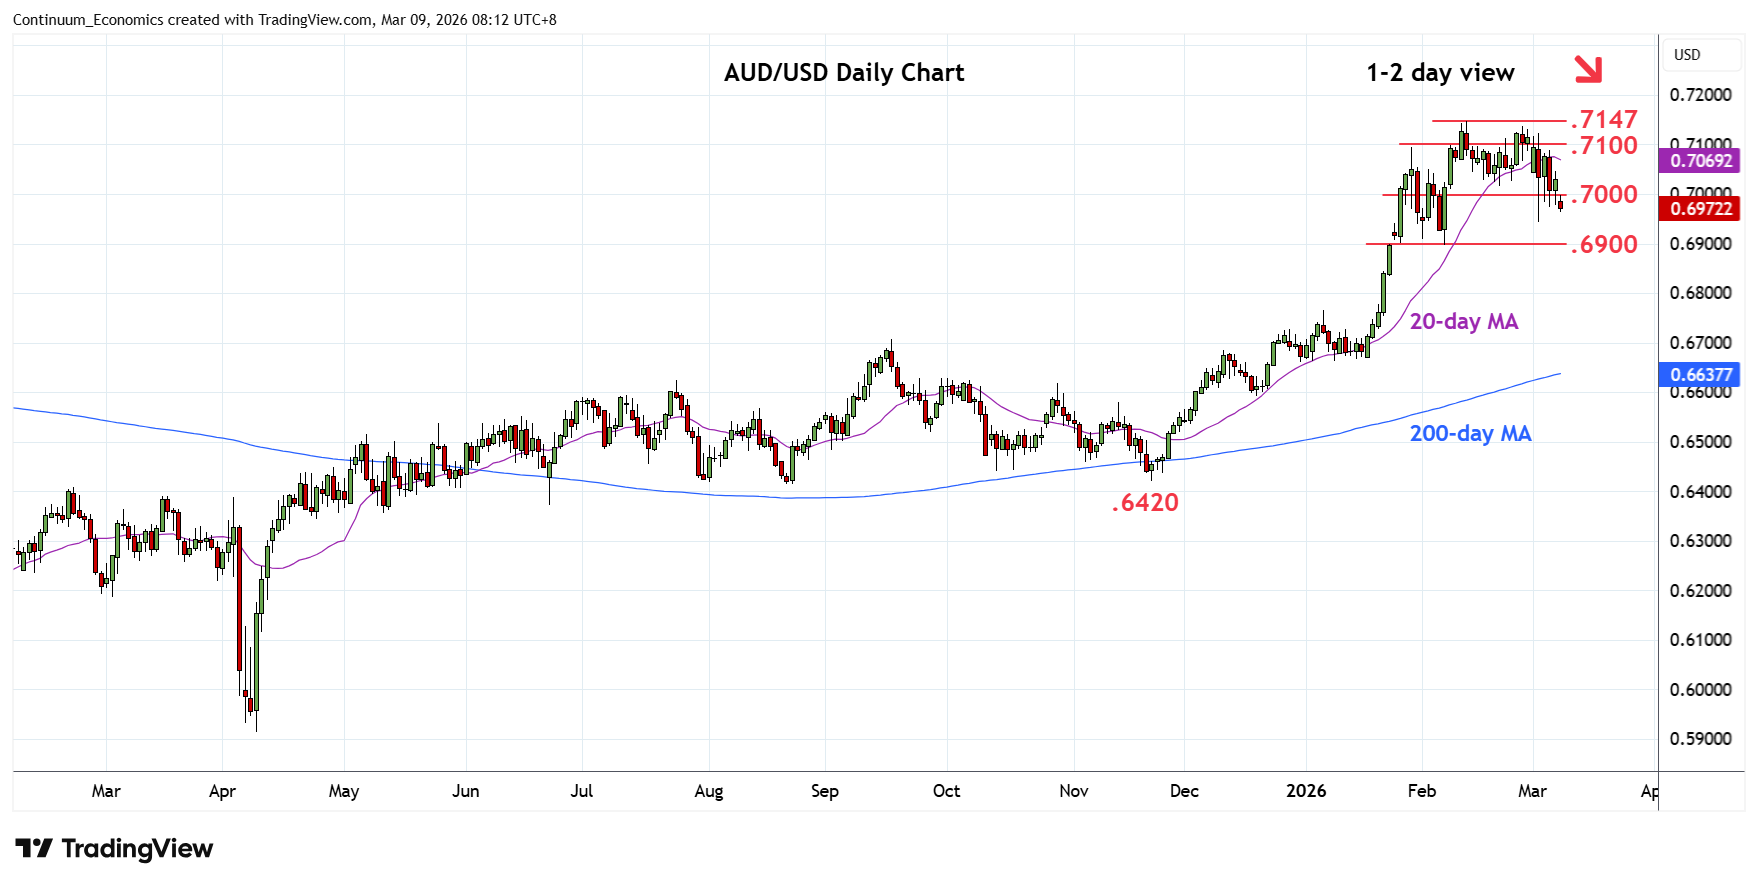
| Levels | Imp | Comment | Levels | Imp | Comment | |||
|---|---|---|---|---|---|---|---|---|
| R4 | 0.7147 | ** | 12 Feb YTD high | S1 | 0.6945 | * | 3 Mar low | |
| R3 | 0.7100 | * | congestion | S2 | 0.6900 | ** | congestion, 6 Feb low | |
| R2 | 0.7050 | * | congestion | S3 | 0.6870 | * | 38.2% Nov/Feb rally | |
| R1 | 0.7000/15 | * | congestion, 20 Feb low | S4 | 0.6800 | * | figure, congestion |
Asterisk denotes strength of level
00:20 GMT - Gapped down at the opening below the .7000 level see prices extending losses to retest the .6945 low of 3 March. Negative daily and weekly studies weighs and suggest scope for break here to further extend losses from the .7147 high to retest the .6900, February low. Lower will see room to .6870, 38.2% Fibonacci retracement. Meanwhile, resistance is lowered to the .7000/15 congestion and 20 February low, now expected to cap and sustain losses from the .7137/.7147, February double top.