Published: 2026-05-14T07:14:11.000Z
Chart EUR/AUD Update: Weighing on 1.6130 low
2
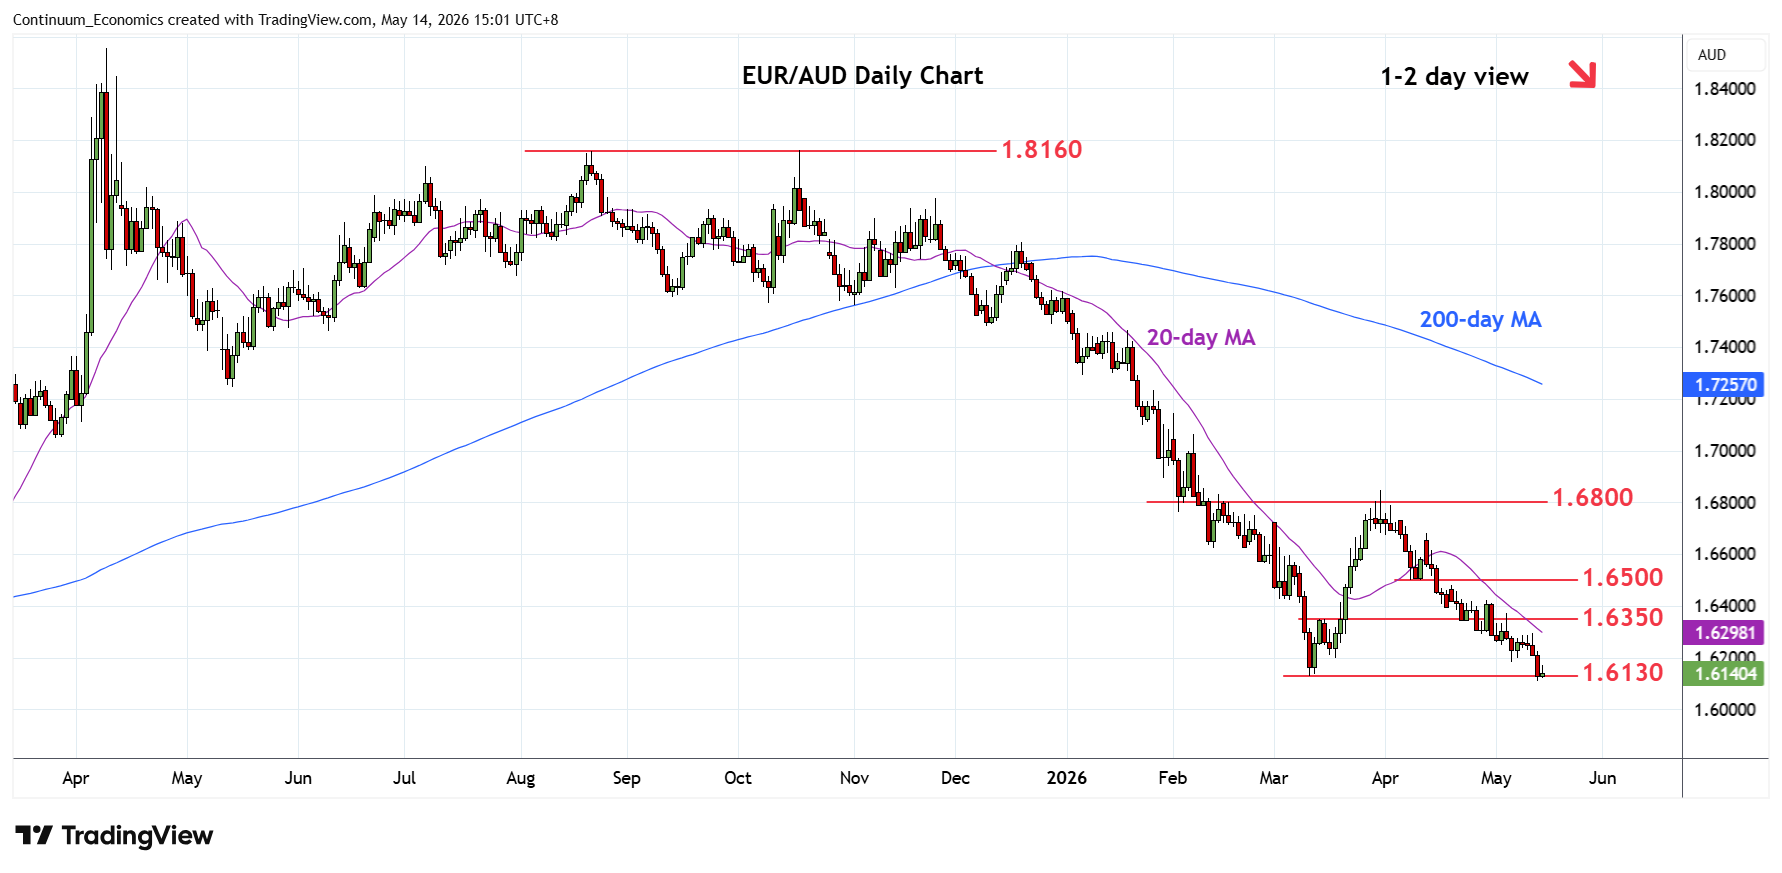
Break of the 1.6200 level see prices back to retest the 1.6130 March current year low
| Levels | Imp | Comment | Levels | Imp | Comment | |||
|---|---|---|---|---|---|---|---|---|
| R4 | 1.6500 | ** | congestion, 8 Apr low | S1 | 1.6130 | ** | 11 Mar YTD low | |
| R3 | 1.6400/25 | * | congestion, 5 Mar low | S2 | 1.6000 | ** | figure, congestion | |
| R2 | 1.6350 | * | congestion | S3 | 1.5960 | ** | 2024 year low | |
| R1 | 1.6200 | * | congestion | S4 | 1.5910 | * | 61.8% 2022/2025 rally |
Asterisk denotes strength of level
07:10 GMT - Break of the 1.6200 level see prices back to retest the 1.6130 March current year low. Bearish structure see risk for break here to extend the broader losses from the April 2025 year high and see extension to 1.6000 figure and 1.5960, 2024 year low. Lower still, will see room to 1.5910, 61.8% Fibonacci retracement. Meanwhile, resistance is lowered to the 1.6200 level. Above here will ease the downside pressure and see room to stronger gains to resistance at the 1.6350/1.6425 congestion area which is expected to cap.