Chart EUR/CAD Update: Under pressure

Cautious trade is giving way to the anticipated drift lower
| Level | Comment | Level | Comment | |||||
|---|---|---|---|---|---|---|---|---|
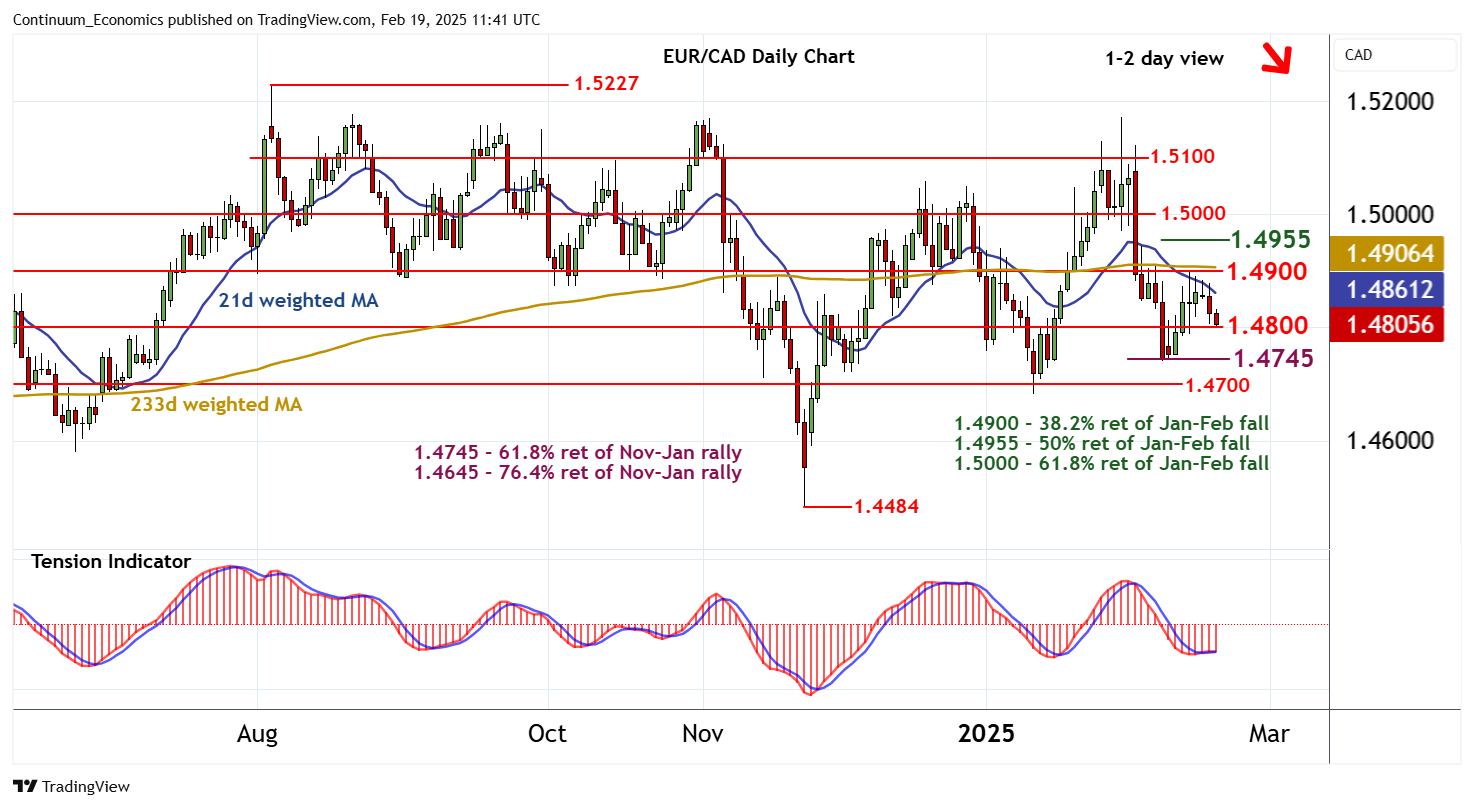
| R4 | 1.5100 | * | congestion | S1 | 1.4800 | * | congestion | |
| R3 | 1.5000 | ** | congestion, 61.8% ret | S2 | 1.4745 | ** | 61.8% ret of Nov-Jan rally | |
| R2 | 1.4955 | ** | 50% ret of Jan-Feb fall | S3 | 1.4700 | * | congestion | |
| R1 | 1.4900 | ** | break level, 38.2% ret | S4 | 1.4645 | ** | 76.4% ret of Nov-Jan rally |
Asterisk denotes strength
11:00 GMT - Cautious trade is giving way to the anticipated drift lower, as intraday studies continue to fall, with prices currently pressuring congestion support at 1.4800.Rising daily stochastics have ticked down and the daily Tension Indicator is flattening, suggesting room for a break towards stronger support at the 1.4745 Fibonacci retracement. Broader weekly charts are also bearish, but a close beneath here is needed to add weight to sentiment and confirm continuation of January losses. Meanwhile, resistance remains at 1.4900. A close above here, if seen, would improve sentiment and open up the 1.4955 Fibonacci retracement, where renewed selling interest is expected to appear.