Published: 2026-03-31T00:26:08.000Z
Chart AUD/USD Update: Under pressure
1
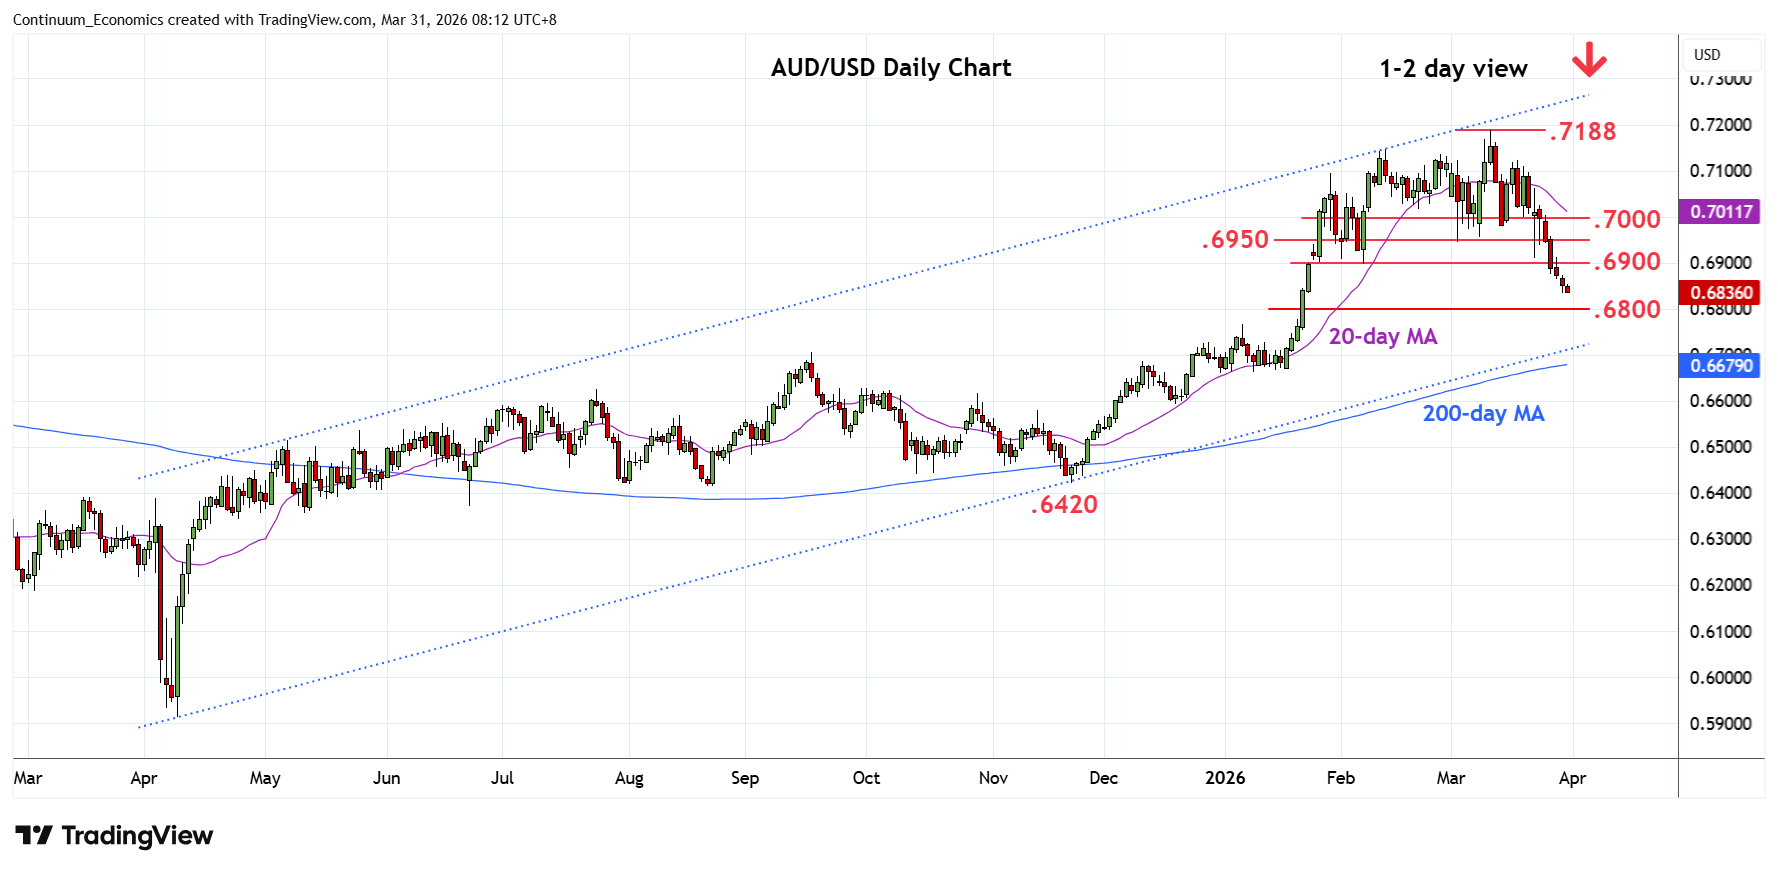
Pressure remains on the downside and consolidation above the .6833 low expected to give way to further losses later
| Levels | Imp | Comment | Levels | Imp | Comment | |||
|---|---|---|---|---|---|---|---|---|
| R4 | 0.7050 | * | congestion | S1 | 0.6805/00 | * | 50%, congestion | |
| R3 | 0.7000 | ** | congestion | S2 | 0.6765 | * | 7 Jan high | |
| R2 | 0.6950 | * | congestion | S3 | 0.6715 | * | 61.8% Nov/Mar rally | |
| R1 | 0.6900 | * | congestion | S4 | 0.6707/00 | ** | Sep high, channel |
Asterisk denotes strength of level
00:15 GMT - Pressure remains on the downside and consolidation above the .6833 low expected to give way to further losses later. Lower will further extend losses within the bullish channel from the April 2025 year low to .6805, 50% Fibonacci retracement. Below this will open up room to support at .6765 then the strong support zone at .6715/.6700 area and channel support. Meanwhile, resistance is lowered to the .6900 congestion area which is expected to cap. Break here needed to ease the downside pressure and see room for stronger bounce to the .6950/.7000 congestion area.