Published: 2025-02-10T08:24:35.000Z
Chart GBP/USD Update: Limited tests higher - daily studies under pressure

Senior Technical Strategist
-
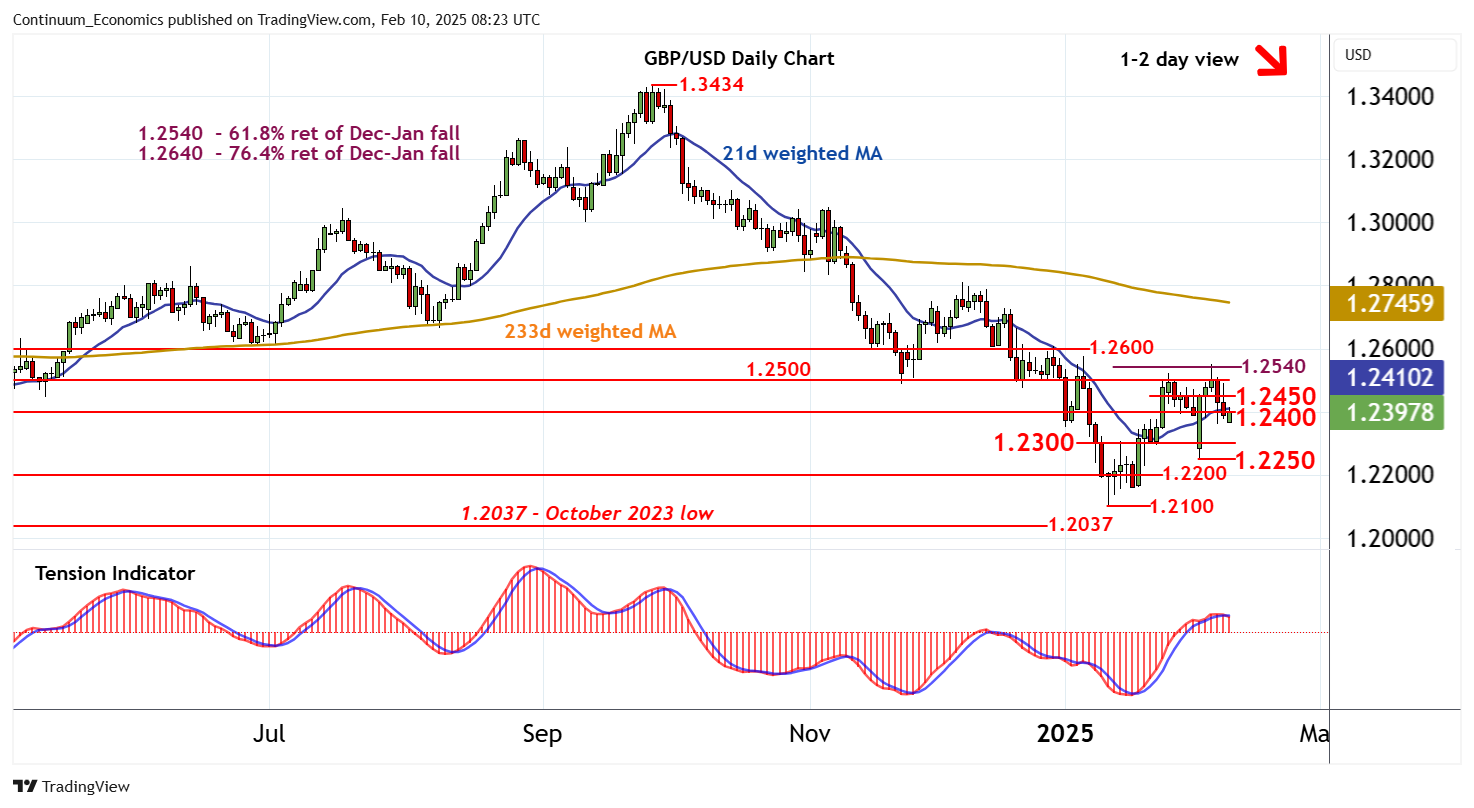
The break below 1.2400 has bounced from 1.2360
| Level | Comment | Level | Comment | |||||
|---|---|---|---|---|---|---|---|---|
| R4 | 1.2600 | * | break level | S1 | 1.2300 | * | break level | |
| R3 | 1.2540 | ** | 61.8% ret of Dec-Jan fall | S2 | 1.2250~ | * | 3 Feb (w) low | |
| R2 | 1.2500 | * | break level | S3 | 1.2200 | * | congestion | |
| R1 | 1.2400 | * | congestion | S4 | 1.2200 | * | congestion |
Asterisk denotes strength of level
08:10 GMT - The break below 1.2400 has bounced from 1.2360, as oversold intraday studies flatten, with prices currently pressuring 1.2400. A break back above here cannot be ruled out, but negative daily stochastics and the deteriorating Tension Indicator are expected to limit scope in renewed selling interest beneath congestion resistance at 1.2450. Following cautious trade, fresh losses are looked for. A break below 1.2360 will open up support at 1.2300. But improving weekly charts are expected to limit any deeper losses in buying interest/consolidation above the 1.2250~ weekly low of 3 February.