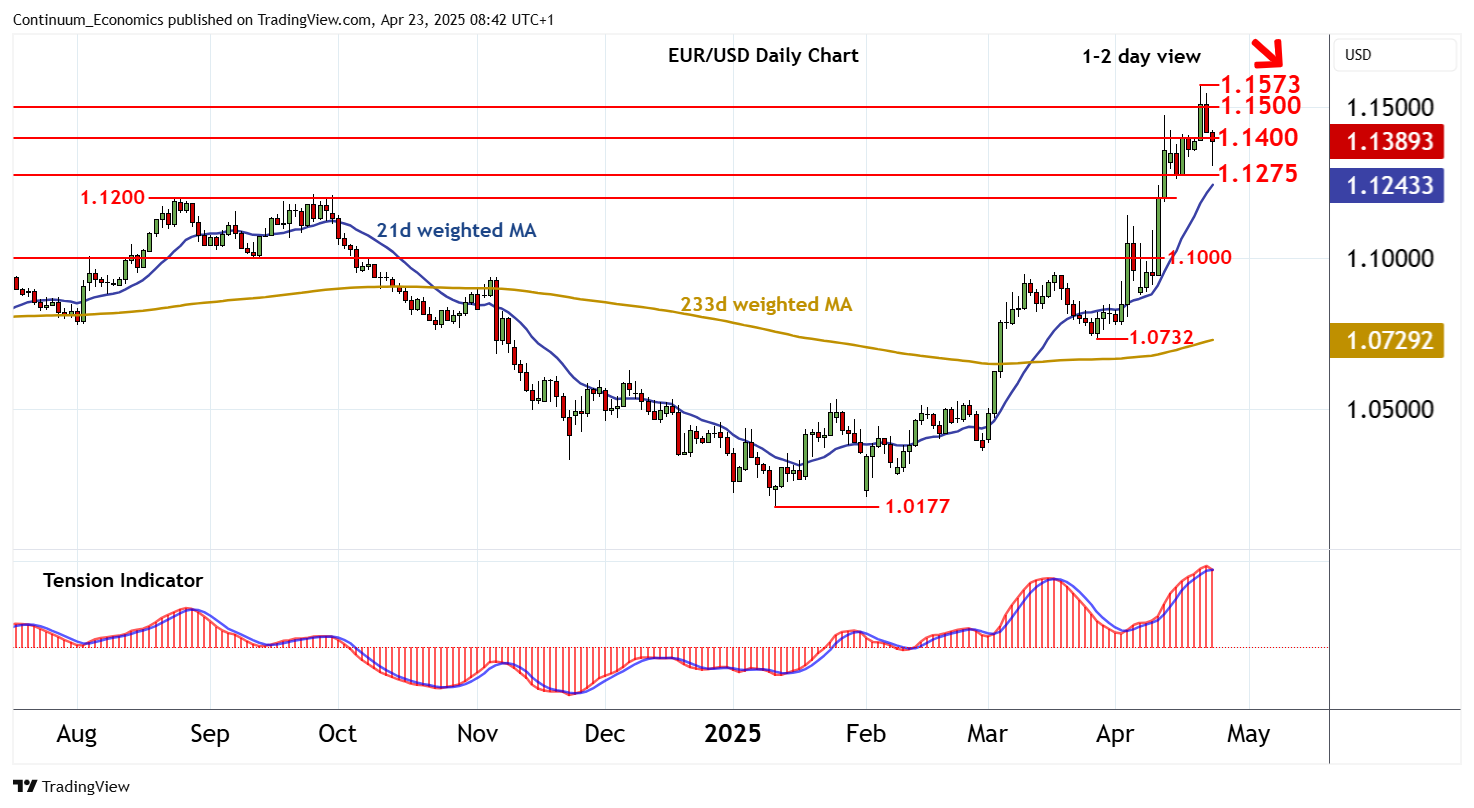
Chart EUR/USD Update: Leaning lower

Cautious trade beneath the 1.1573 current year high of 22 April has given way to a spike down to 1.1300
| Levels | Imp | Comment | Levels | Imp | Comment | |||
|---|---|---|---|---|---|---|---|---|
| R4 | 1.1685 | ** | 76.4% ret of 2021-2022 fall | S1 | 1.1400 | * | congestion | |
| 14 | 1.1600 | congestion | S2 | 1.1275 | ** | July 2023 (y) high | ||
| R2 | 1.1573 | * | 21 Apr YTD high | S3 | 1.1200 | ** | congestion | |
| R1 | 1.1500 | ** | break level | S4 | 1.1100 | * | break level |
Asterisk denotes strength of level
08:30 BST - Cautious trade beneath the 1.1573 current year high of 22 April has given way to a spike down to 1.1300, before bouncing sharply into consolidation around congestion support at 1.1400. Daily stochastics are falling, turning away from overbought areas and unwinding negative divergence, and the the daily Tension Indicator is also coming under pressure, highlighting a deterioration in sentiment and room for further losses in the coming sessions. A break back below 1.1400 will open up the 1.1275 year high of July 2023. However, mixed/positive weekly charts could limit any initial tests in renewed consolidation. A close beneath here, if seen, will turn sentiment negative and extend losses initially to congestion around 1.1200. Meanwhile, resistance is at 1.1500 and extends to 1.1573. A close above here, not yet seen, will turn sentiment positive and extend broad September 2022 gains beyond congestion around 1.1600 towards the 1.1685 Fibonacci retracement.