Published: 2026-01-19T01:06:28.000Z
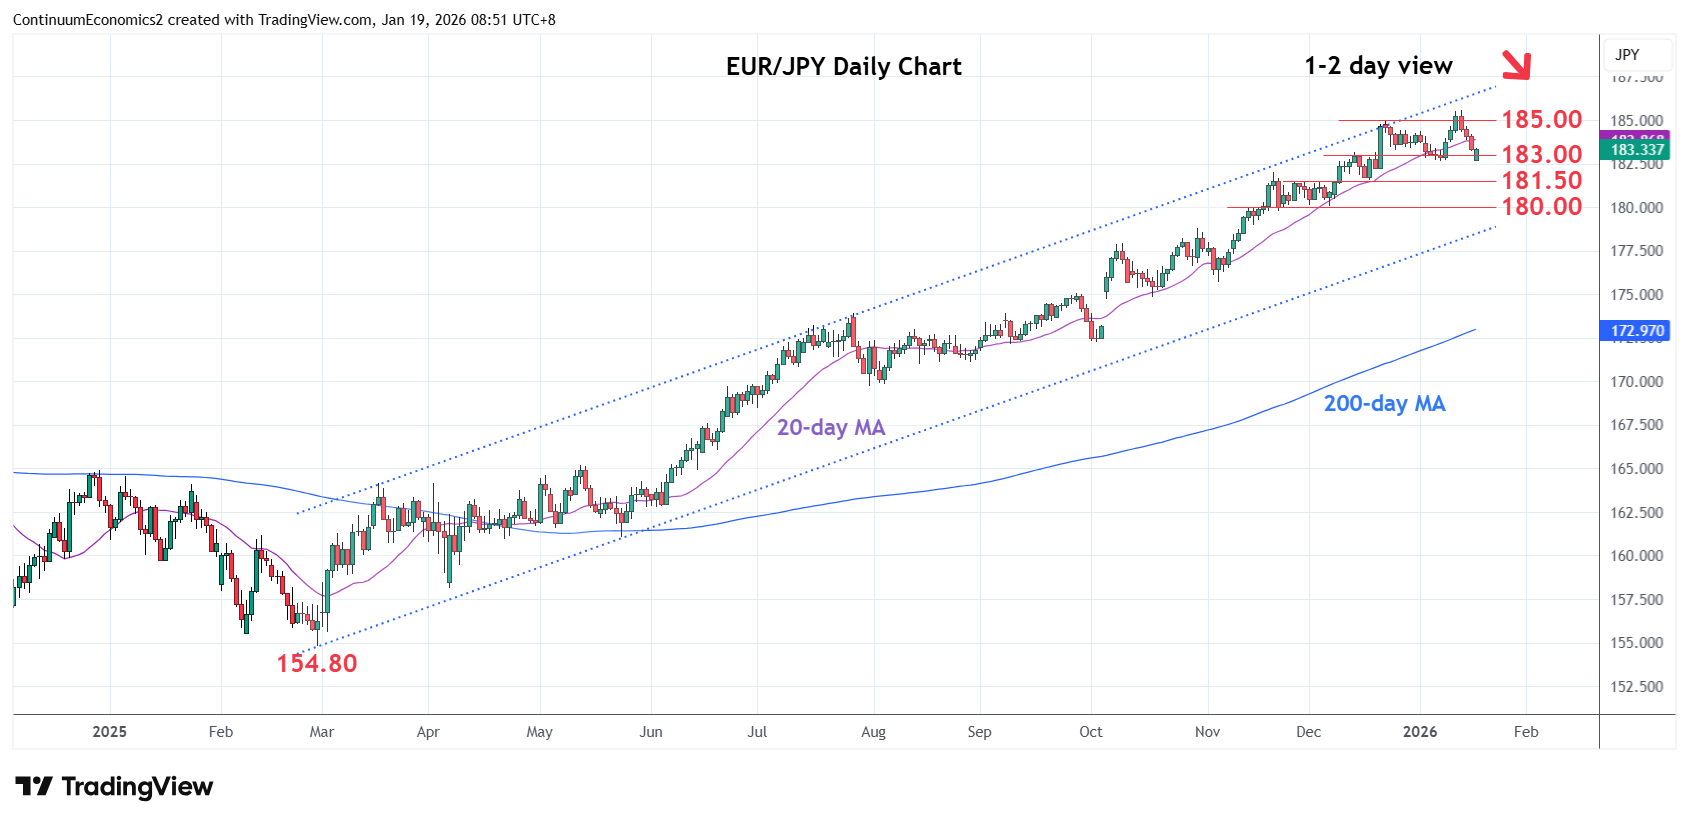
Chart EUR/JPY Update: Consolidating test of 182.65 support
-
Steadied at the 182.65 support and bounce here see prices retracing the gapped down opening and unwinding oversold intraday studies
| Levels | Imp | Comment | Levels | Imp | Comment | |||
|---|---|---|---|---|---|---|---|---|
| R4 | 186.00 | figure | S1 | 182.65 | ** | 8 Jan low | ||
| R3 | 185.57 | ** | 14 Jan YTD high | S2 | 182.00 | * | congestion | |
| R2 | 184.92/00 | * | Dec 2025 yr high, congestion | S3 | 181.50 | ** | congestion | |
| R1 | 184.00 | * | congestion | S4 | 180.00 | ** | figure, congestion |
Asterisk denotes strength of level
01:00 GMT - Steadied at the 182.65 support and bounce here see prices retracing the gapped down opening and unwinding oversold intraday studies. Consolidation at the 183.00 level is expected to give way to renewed selling pressure later to extend losses from 185.57 multi-year high. Below the 182.65 support will see room for deeper pullback within the bullish channel from the late-February low and see extension to strong support at the 182.00/181.50 congestion. Meanwhile, resistance at the 184.00 congestion is expected to cap and sustain pullback from the 184.92/185.57 highs.