Chart USD/ZAR Update: Limited gains from fresh year low

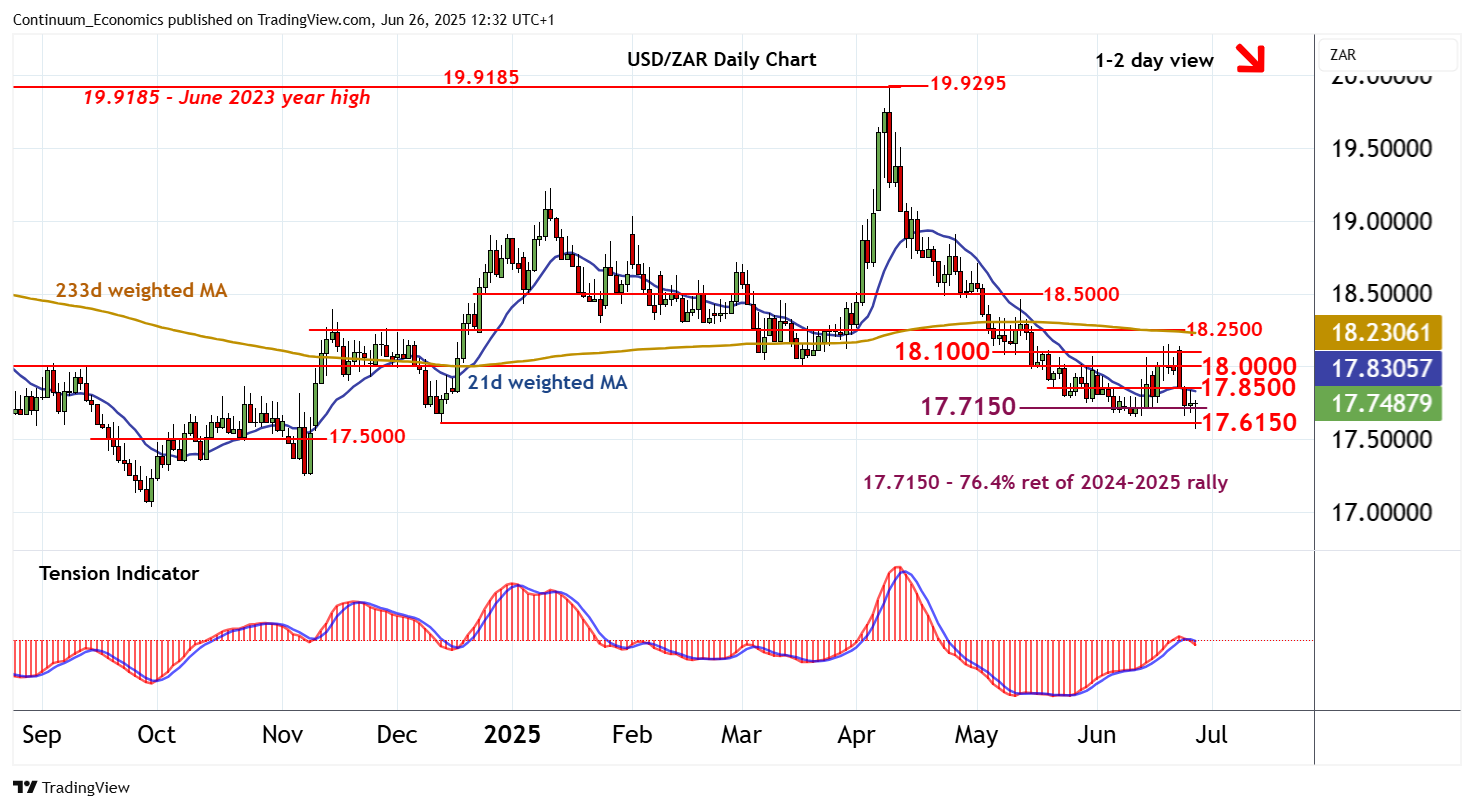
The anticipated test of support at the 17.6150 monthly low of 12 December and the 17.7150 Fibonacci retracement has posted a fresh 2025 year low around 17.5700
| Level | Comment | Level | Comment | |||||
|---|---|---|---|---|---|---|---|---|
| R4 | 18.2500 | * | congestion | S1 | 17.7150 | ** | 76.4% ret of 2024-2025 rally | |
| R3 | 18.1000 | * | break level | S2 | 17.6150 | ** | 12 Dec (m) low | |
| R2 | 18.0000 | ** | congestion | S3 | 17.5000 | * | congestion | |
| R1 | 17.8500 | break level | S4 | 17.2500 | ** | 7 Nov (m) low |
Asterisk denotes strength of level
12:15 BST - The anticipated test of support at the 17.6150 monthly low of 12 December and the 17.7150 Fibonacci retracement has posted a fresh 2025 year low around 17.5700, before bouncing back into cautious trade above 17.7150. Rising intraday studies highlight potential for a test of resistance at 17.8500. But negative daily readings and mixed/negative weekly charts should limit any further gains in renewed selling interest towards 18.0000-18.1000. Following cautious trade, fresh losses are looked for. However, a close below 17.6150 is needed to turn sentiment negative and extend losses from the 19.9250 current year high of 9 April, initially to congestion around 17.5000.