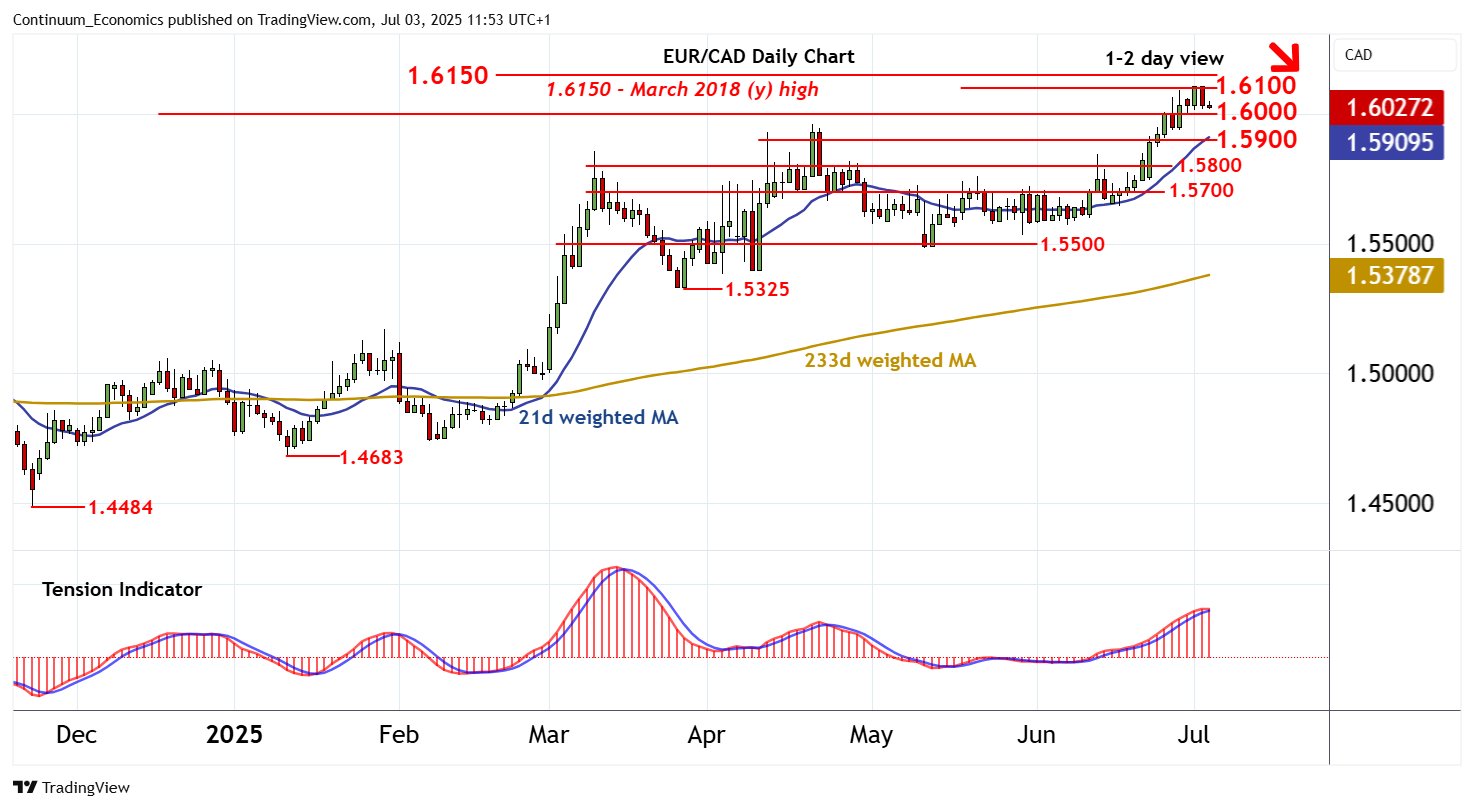
Chart EUR/CAD Update: Turning away from fresh year highs

Anticipated gains have been marginal
| Level | Comment | Level | Comment | |||||
|---|---|---|---|---|---|---|---|---|
| R4 | 1.6325~ | ** | Jun-July 2009 high | S1 | 1.6000 | ** | congestion | |
| R3 | 1.6200 | historic congestion | S2 | 1.5900 | * | congestion | ||
| R2 | 1.6150~ | ** | March 2018 (y) high | S3 | 1.5800 | congestion | ||
| R1 | 1.6100/09 | * | cong; 1 Jul YTD high | S4 | 1.5700 | break level |
Asterisk denotes strength
11:30 BST - Anticipated gains have been marginal, with prices posting a fresh year high just above 1.6100 before turning back as overbought intraday studies unwind. Steady selling interest has reached 1.6030, where fresh consolidation is developing. However, overbought daily stochastics are unwinding and the daily Tension Indicator is turning down, highlighting room for continuation down to congestion support at 1.6000. A break will open up 1.5900, where positive longer-term charts could prompt renewed buying interest. Meanwhile, a close above 1.6100/09, not yet seen, will turn sentiment positive once again and extend August 2022 gains towards critical multi-year resistance at the 1.6150~ year high of March 2018. Continuation beyond here will extend broader 2012 gains into levels from 3Q2009.