Published: 2026-01-16T07:20:30.000Z
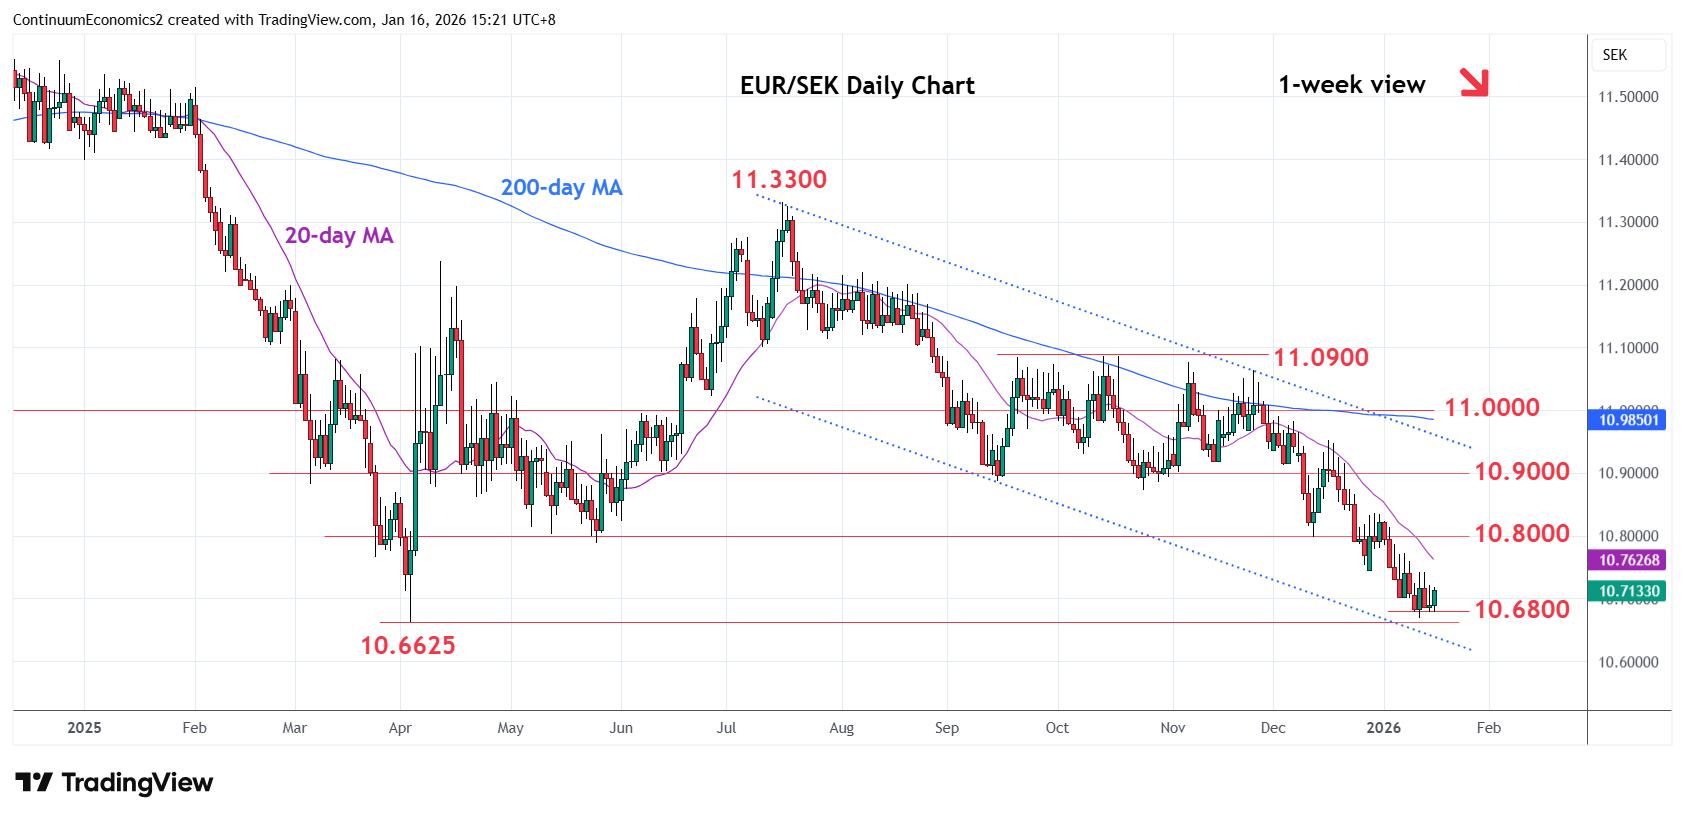
Chart EUR/SEK Update: Consolidating test of 10.6800/10.6625 support
-
Break of the 10.7500 December low see prices extending losses from the July swing high to reach strong support at the 10.6800/10.6625 area
| Levels | Imp | Comment | Levels | Imp | Comment | |||
| R4 | 10.9000 | ** | congestion | S1 | 10.6800 | * | 61.8% 2021/2023 rally | |
| R3 | 10.8700 | * | Oct low | S2 | 10.6625 | ** | Apr 2025 year low | |
| R2 | 10.8000 | * | 11 Dec low, congestion | S3 | 10.6000 | * | Sep 2022 low, congestion | |
| R1 | 10.7500 | congestion | S4 | 10.5400 | * | 25 Aug 2022 low |
Asterisk denotes strength of level
07:15 GMT - Break of the 10.7500 December low see prices extending losses from the July swing high to reach strong support at the 10.6800/10.6625 area. Oversold daily and weekly studies suggest reaction here likely to consolidate losses from the 11.0900, September/October highs. Bounce see resistance starting at 10.7500/10.8000 congestion area. Above here will open up room for stronger correction to the 10.8700/10.9000 area. Meanwhile support at the 10.6800/10.6625 area should now underpin. A later break will open up room for deeper retracement of the 2021/2023 rally