Published: 2026-01-02T00:40:07.000Z
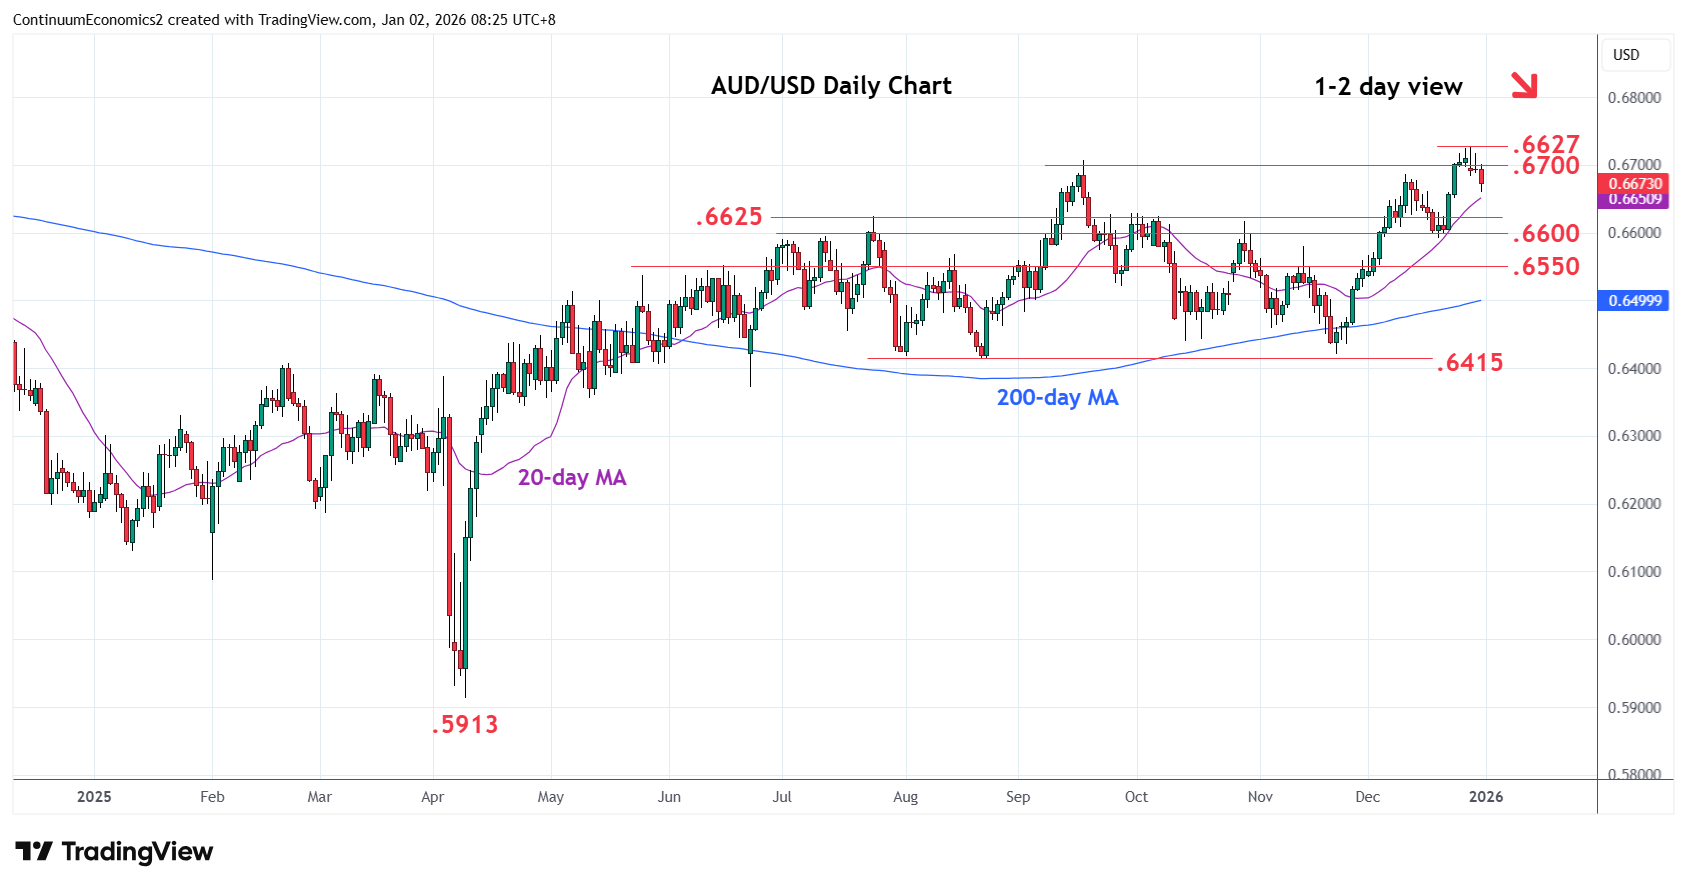
Chart AUD/USD Update: Leaning lower in consolidation from December high
-
Leaning lower from the .6727 high as prices consolidate gains from the .6421 low of November
| Levels | Imp | Comment | Levels | Imp | Comment | |||
|---|---|---|---|---|---|---|---|---|
| R4 | 0.6800 | * | congestion | S1 | 0.6650 | * | congestion | |
| R3 | 0.6750 | * | congestion | S2 | 0.6625/00 | ** | Jul 2025 high, congestion | |
| R2 | 0.6727 | ** | 29 Dec 2025 year high | S3 | 0.6550 | * | congestion | |
| R1 | 0.6700 | * | congestion | S4 | 0.6500 | * | congestion |
Asterisk denotes strength of level
00:30 GMT - Leaning lower from the .6727 high as prices consolidate gains from the .6421 low of November and unwind overbought daily studies. Pullback see support starting at .6650 congestion then the strong support at the .6625/.6600 area which is expected to underpin. Correction is expected to give way to buying interest later to extend bullish structure from the low of last year to retest .6700/27 resistance. Clearance here e here will further retrace the broader losses from February 2021 year high and see room to .6750/.6800 area.