Published: 2026-02-24T12:35:11.000Z
Chart USD/ZAR Update: Cautious trade
3
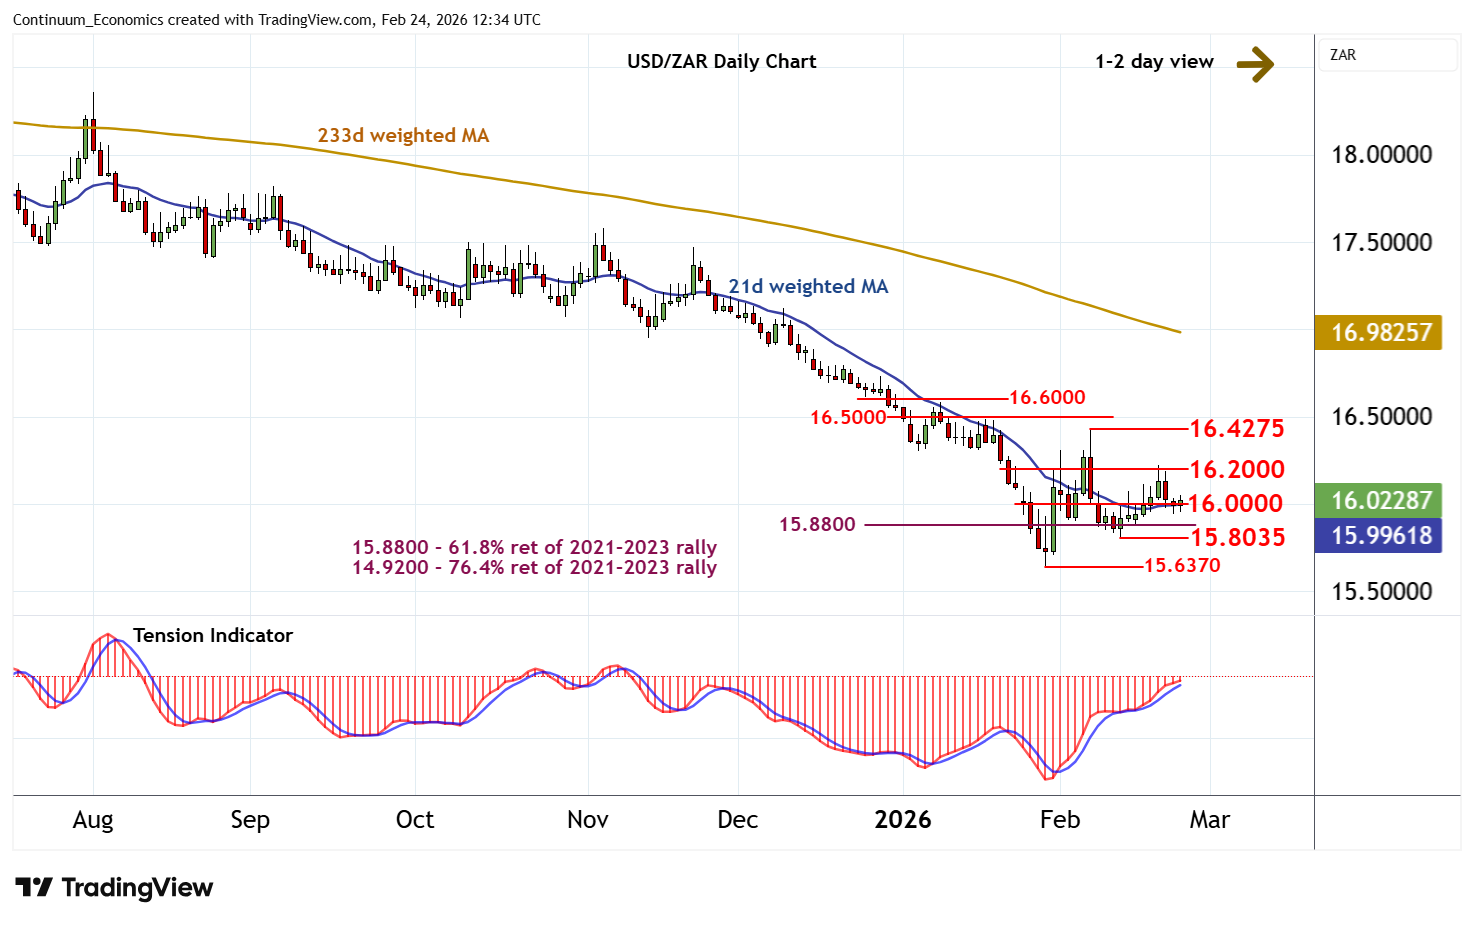
Little change, as prices extend cautious trade around congestion support at 16.0000
| Level | Comment | Level | Comment | |||||
|---|---|---|---|---|---|---|---|---|
| R4 | 16.6000 | break level | S1 | 16.0000 | ** | congestion | ||
| R3 | 16.5000 | break level | S2 | 15.8035 | * | 12 Feb (w) low | ||
| R2 | 16.4275 | * | 6 Feb (w) high | S3 | 15.6370 | ** | 29 Jan YTD low | |
| R1 | 16.2000 | minor congestion | S4 | 15.1665 | * | June 2022 low |
Asterisk denotes strength of level
12:25 GMT - Little change, as prices extend cautious trade around congestion support at 16.0000. Overbought daily stochastics are unwinding and the rising daily Tension Indicator is showing early signs of turning down, suggesting potential for a fresh test below here. Focus will then turn to the 15.8035 weekly low of 12 February. But rising oversold weekly stochastics should limit any initial tests in consolidation. Meanwhile, resistance remains at 16.2000 and should cap any immediate tests higher.