Published: 2026-03-20T00:21:09.000Z
Chart AUD/USD Update: Choppy within the .7100/.7000 range
-
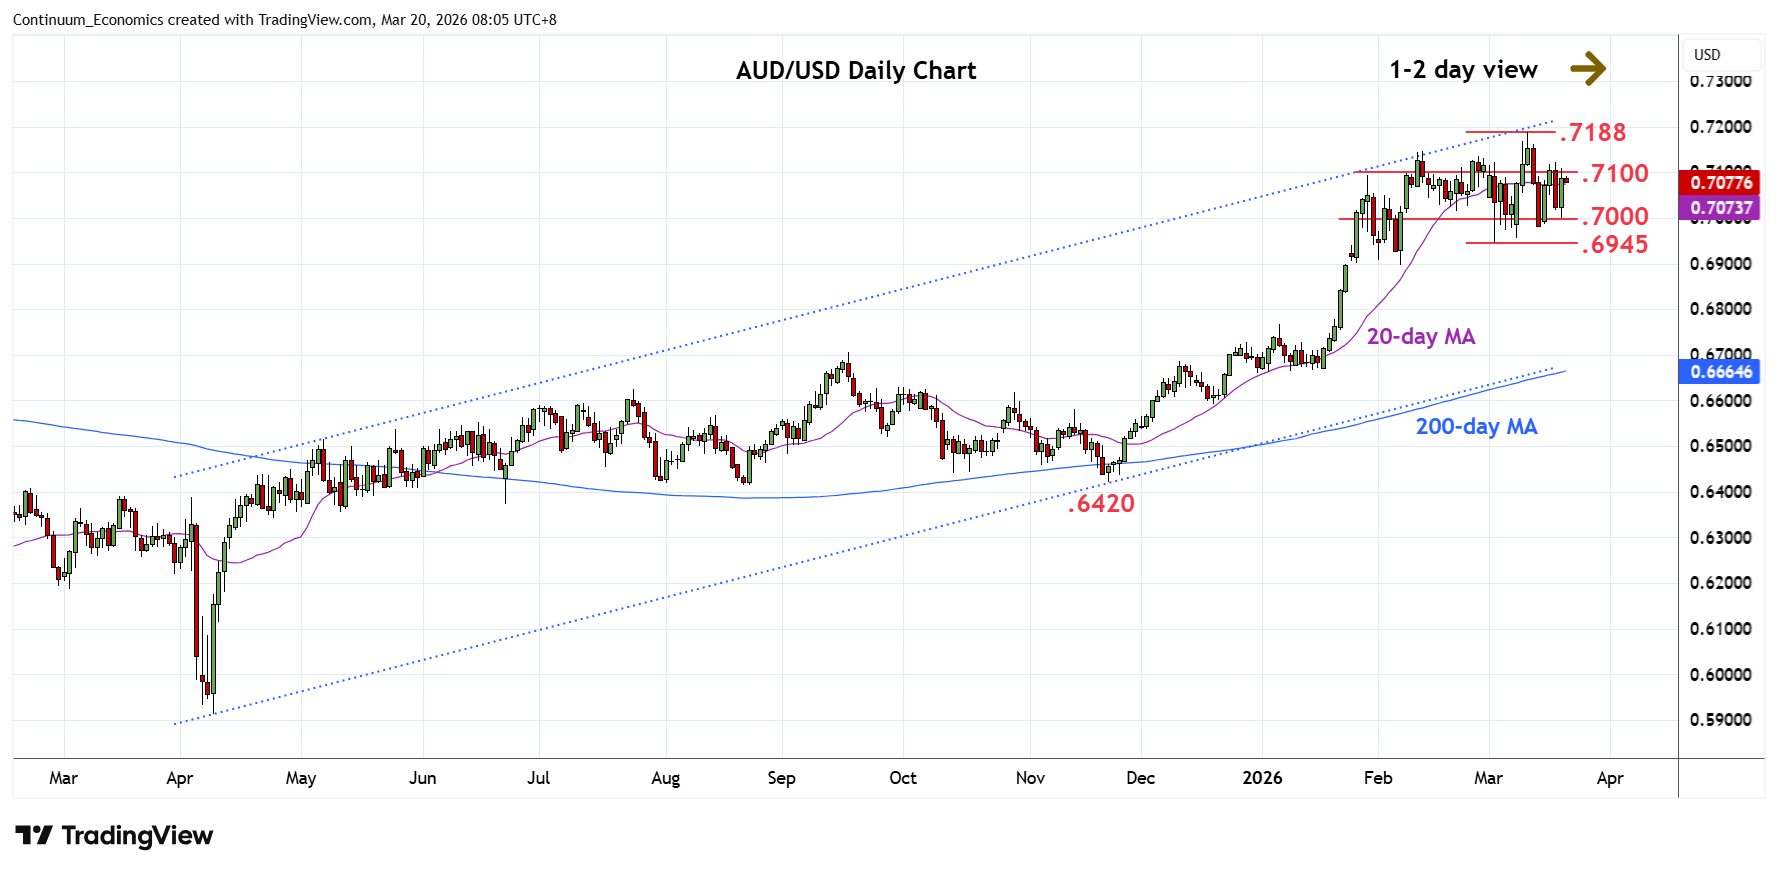
Still little change, as prices extend choppy trade within the .7100/.7000 range
| Levels | Imp | Comment | Levels | Imp | Comment | |||
|---|---|---|---|---|---|---|---|---|
| R4 | 0.7200 | * | congestion, 61.8% | S1 | 0.7000 | * | congestion | |
| R3 | 0.7188 | ** | 11 Mar YTD high | S2 | 0.6980 | * | 13 Mar low | |
| R2 | 0.7147 | * | Feb high | S3 | 0.6945 | ** | 3 Mar low | |
| R1 | 0.7100 | * | congestion | S4 | 0.6900 | ** | Feb low, congestion |
Asterisk denotes strength of level
00:15 GMT - Still little change, as prices extend choppy trade within the .7100/.7000 range following rejection from the .7188 current year high. While the latter caps scope is pullback to retest the .6980 and .6945 recent lows. Would take break of these will open up room for deeper pullback within the bullish channel from the April low to strong support at the .6900/.6895, February low and 38.2% Fibonacci retracement. Below these will confirm a top pattern at the February/March highs and see deeper pullback to retrace the November/March rally.