Published: 2025-09-03T06:03:10.000Z
Chart USD/IDR Updates: Lower in consolidation
0
-
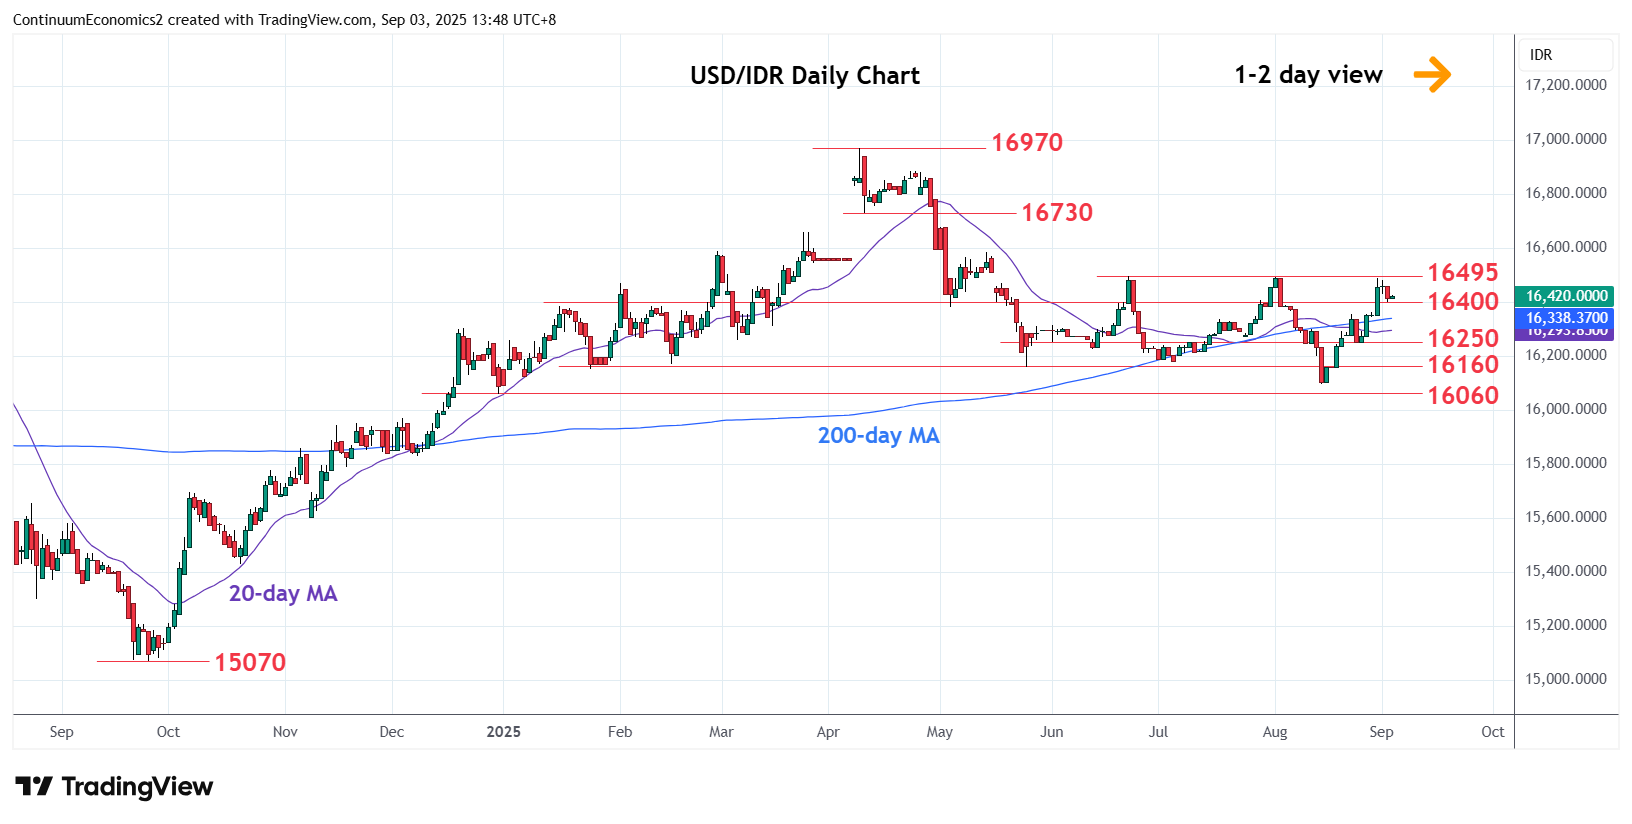
Settling back from test of the 16490/16495, August and June highs, as prices consolidate rally from the 16095 low
| Levels | Imp | Comment | Levels | Imp | Comment | |||
|---|---|---|---|---|---|---|---|---|
| R4 | 16730 | ** | 10 Apr low | S1 | 16355 | * | 22 Aug high | |
| R3 | 16635 | * | 61.8% Apr/Aug fall | S2 | 16250 | * | 25 Aug low | |
| R2 | 16585 | * | 14 May high | S3 | 16160 | * | May low, congestion | |
| R1 | 16490/95 | ** | 1 Aug, Jun highs | S4 | 16095 | ** | 14 Aug YTD low |
Asterisk denotes strength of level
06:00 GMT - Settling back from test of the 16490/16495, August and June highs, as prices consolidate rally from the 16095 low. Daily studies are coming under pressure from overbought area, suggesting room for pullback to support at the 16355/16250 area. Break here will return focus to the downside and open up room for retest of the 16160 and 16095 lows. Meanwhile, resistance at the 16490/16495 highs now expected to cap. Clearance, if seen, will see scope to the 16585 resistance and 16635, 61.8% Fibonacci level.