Published: 2026-02-24T00:20:51.000Z
Chart AUD/USD Update: Extend consolidation below .7100
1
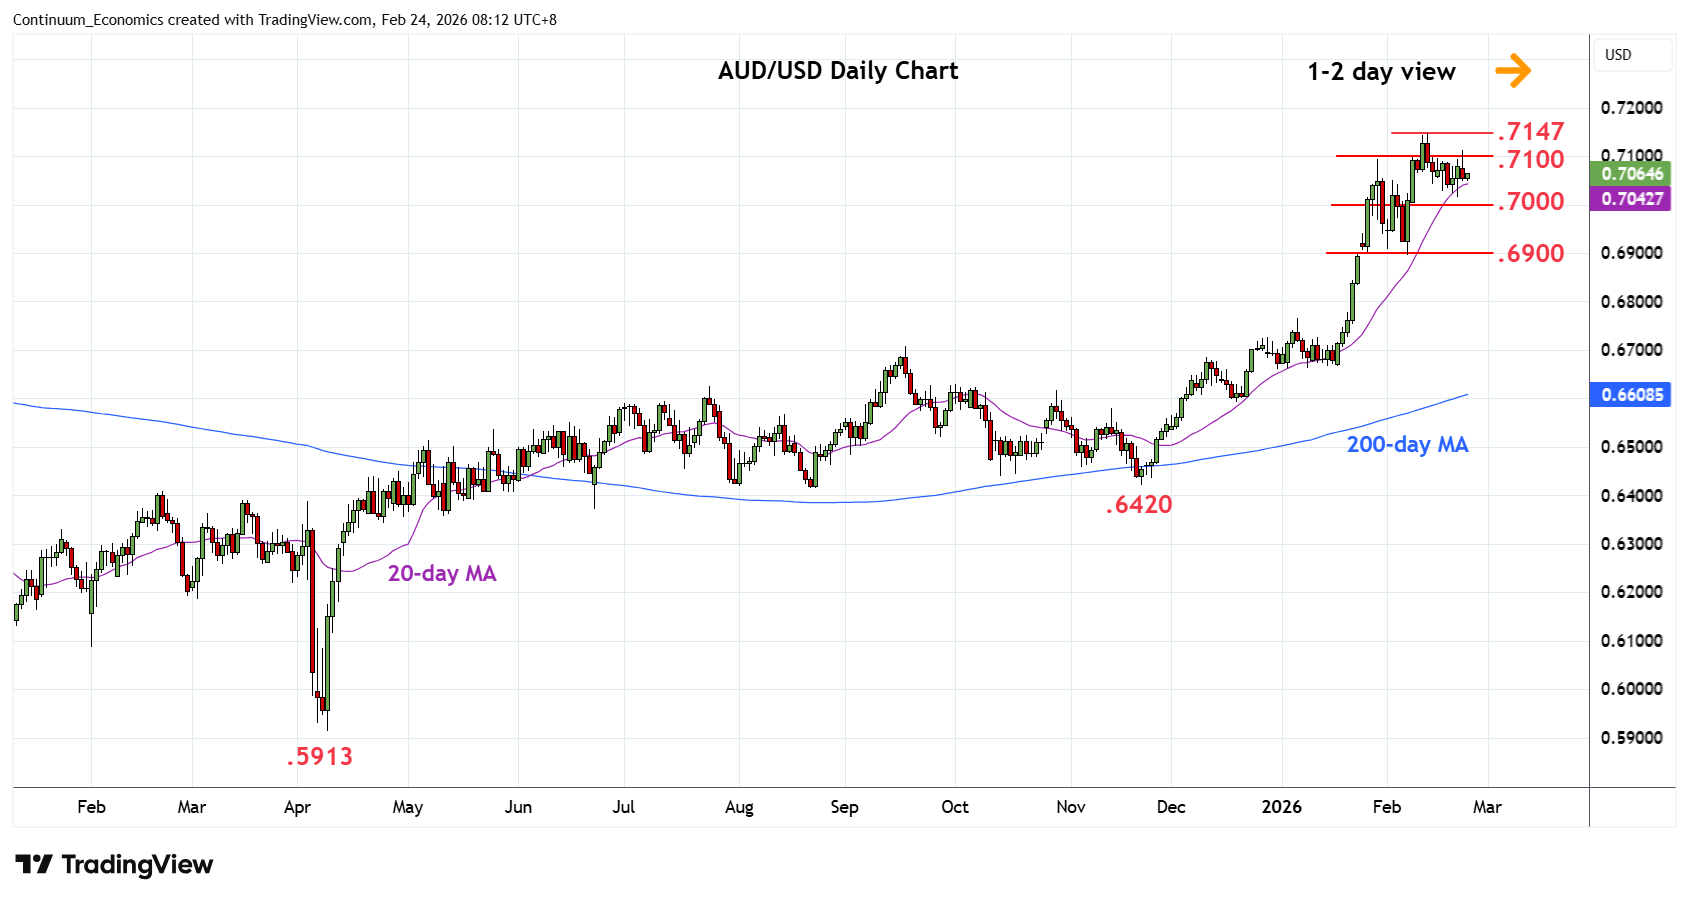
Little change, as prices settled back in consolidation following failure to sustain break above resistance at .7100
| Levels | Imp | Comment | Levels | Imp | Comment | |||
|---|---|---|---|---|---|---|---|---|
| R4 | 0.7280 | * | Jun 2022 high | S1 | 0.7015 | * | 20 Feb low | |
| R3 | 0.7205 | * | 61.8% 2021/2025 fall | S2 | 0.6900 | ** | congestion, 6 Feb low | |
| R2 | 0.7147 | ** | 12 Feb YTD high | S3 | 0.6870 | * | 38.2% Nov/Feb rally | |
| R1 | 0.7100 | * | congestion | S4 | 0.6800 | * | congestion |
Asterisk denotes strength of level
00:15 GMT - Little change, as prices settled back in consolidation following failure to sustain break above resistance at .7100. Would need to regain this to expose the .7147 high to retest and see scope to further retrace the 2021/2025 losses to .7205, 61.8% Fibonacci level. Meanwhile, support at the .7015 low should underpin. Would take break here to open up room for deeper pullback to retrace the November/February rally. Lower will see room for deeper pullback to strong support at the .6900 level and .6870, 38.2% Fibonacci level.