Continuum Economics
  • Search
  • About Us
  • Buy
  • Invite A Friend
  • My Basket
  • Articles
  • Calendar
  • Forecasts
  • Events
  • Data
  • Newsletters
  • My Alerts
  • Community
  • Directory
  • About Us
  • Buy
  • Invite A Friend
  • My Basket
  • Articles
    • All
    • Thematic
    • Tactical
    • Asia
    • EMEA
    • Americas
    • Newsletters
    • Freemium
    • Editor's Choice
    • Most Viewed
    • Most Shared
    • Most Liked
  • Calendar
    • Interactive
      • China
      • United States
      • Eurozone
      • United Kingdom
    • Month Ahead
    • Reviews
    • Previews
  • Forecasts
    • Forecasts
    • Key Views
  • Events
    • Media
    • Conference Calls
  • Data
    • Country Insights
    • Shadow Credit Ratings
    • Full CI Data Download
  • Newsletters
  • My Alerts
  • Community
    • FX
    • Fixed Income
    • Macro Strategy
    • Credit Markets
    • Equities
    • Commodities
    • Precious Metals
    • Renewables
  • Directory
  • My Account
  • Notifications Setup
  • Administration Panel
  • Account Details
  • Recent Devices
  • Distribution Lists
  • Shared Free Trials
  • Saved Articles
  • Shared Alerts
  • My Posts
Published: 2026-01-23T12:30:17.000Z

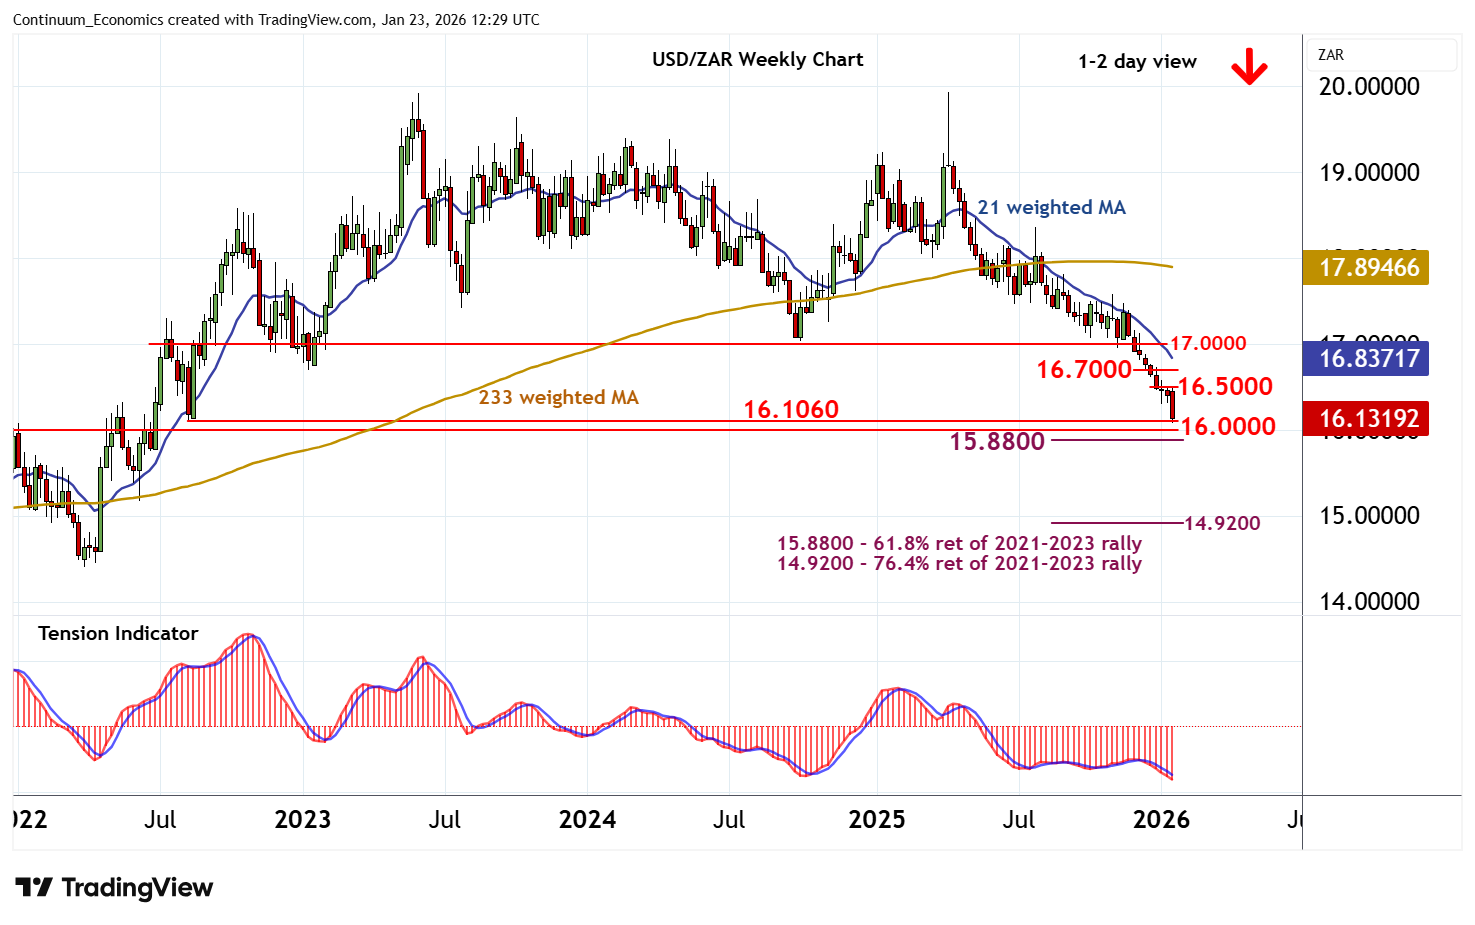
Chart USD/ZAR Update: Another 2026 year low

-

Cautious trade has posted a fresh 2026 year low

 Level Comment  Level Comment
R4 16.8000 break level S1 16.1060**11 Aug 2022 (m) low
R3 16.7000 break level S2 16.0770 fresh 2026 (y) low
R2 16.6000 break level S3 16.0000**congestion
R1 16.5000 break level S4 15.8800**61.8% ret of 2021-2023 rally

Asterisk denotes strength of level

12:20 GMT - Cautious trade has posted a fresh 2026 year low just beneath the 16.1060 monthly low of 11 August 2022 around 16.0770, before bouncing back into consolidation above 16.1060. Daily readings are falling and broader weekly charts are negative, highlighting room for still further losses in the coming sessions. A fresh break below 16.1060 will open up historic congestion around 16.0000 and the 15.8800 Fibonacci retracement. But flat oversold weekly stochastics are expected to limit any initial tests in short-covering/consolidation, before negative longer-term charts extend losses still further. Meanwhile, resistance remains at 16.5000. A close above here, if seen, will help to stabilise price action and prompt consolidation beneath 16.6000.

Continue to read the article for free
Login

or

or

Topics
USD/ZAR-TA
Technical Analysis
EEMEA-Technical

GENERAL

  • Home
  • About Us
  • Our Team
  • Careers

LEGAL

  • Terms and Conditions
  • Privacy Policy
  • Compliance
  • GDPR

GET IN TOUCH

  • Contact Us
Continuum Economics
The Technical Analyst Awards Winner 2021
The Technical Analyst Awards Finalist 2020
image