Published: 2026-03-05T14:56:38.000Z
Chart AUD/USD Update: Leaning lower in range
5
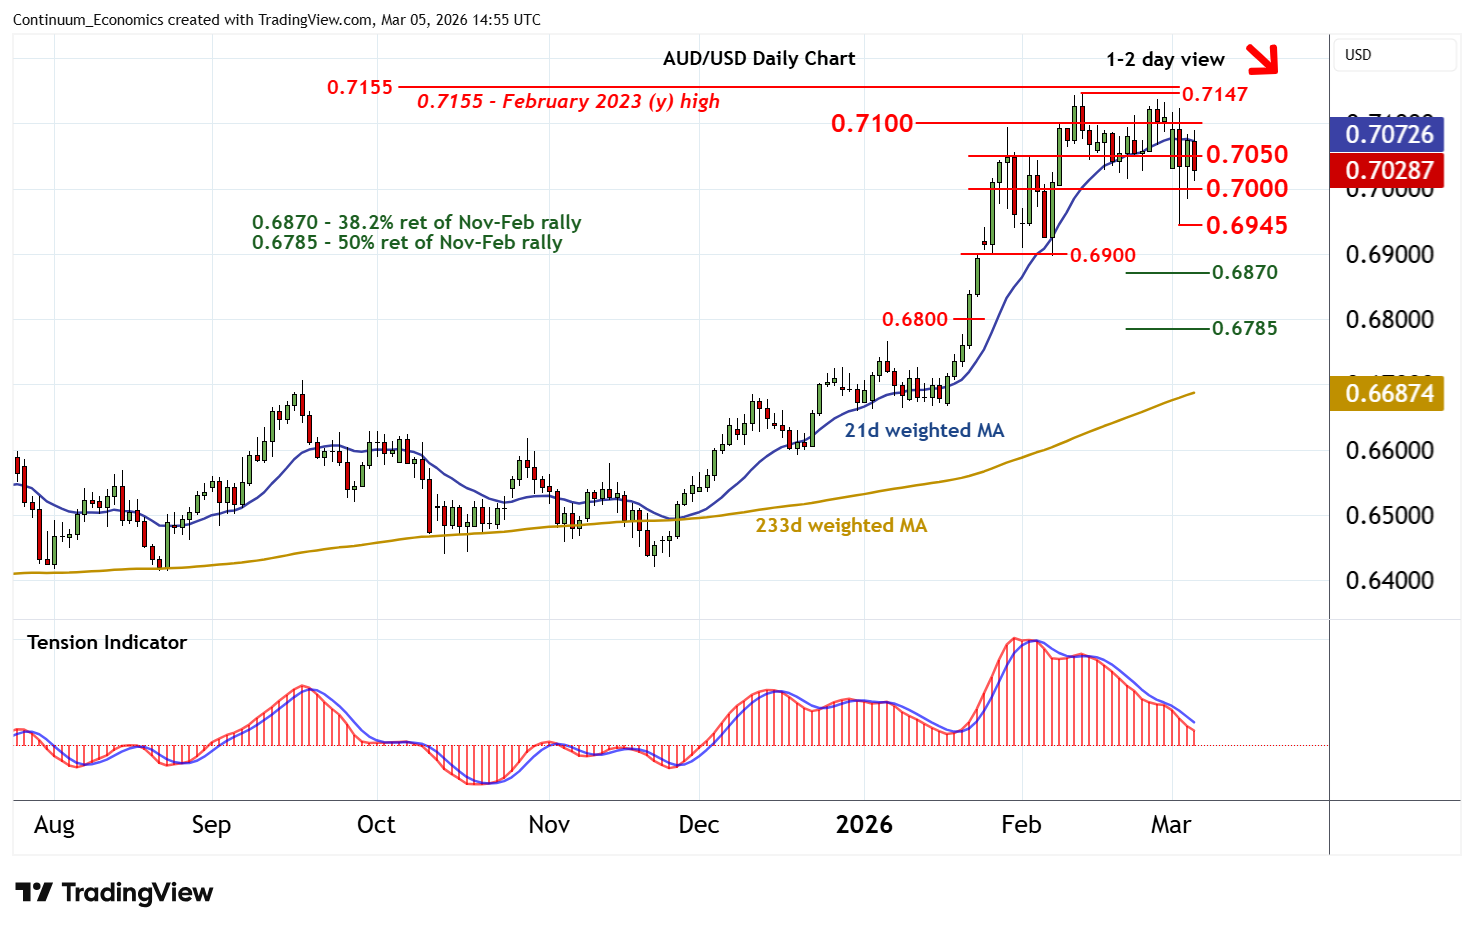
Little change, as prices extend consolidation within the 0.7000 - 0.7100 range
| Levels | Imp | Comment | Levels | Imp | Comment | |||
|---|---|---|---|---|---|---|---|---|
| R4 | 0.7210 | ** | 61.8% ret of 2021-2025 fall | S1 | 0.7000 | * | congestion | |
| R3 | 0.7147/55~ | ** | 12 Feb YTD high; Feb 2023 (y) high | S2 | 0.6945 | 3 Mar low | ||
| R2 | 0.7100 | break level | S3 | 0.6900 | ** | break level | ||
| R1 | 0.7050 | * | congestion | S4 | 0.6870 | * | 38.2% ret of Nov-Feb rally |
Asterisk denotes strength of level
14:50 GMT - Little change, as prices extend consolidation within the 0.7000 - 0.7100 range. Daily readings continue to track lower and broader weekly charts are under pressure, highlighting room for fresh losses in the coming sessions. A later close below congestion support at 0.7000 will complete a distribution top beneath the 0.7147 current year high of 12 February, as focus then turns to the 0.6945 loow of 3 March, ahead of 0.6900. Meanwhile, resistance remains at congestion around 0.7050 and extends to 0.7100. This range should cap any immediate tests higher.