Chart GBP/USD Update: Leaning lower
Consolidation above 1.3400 has given way to a test lower to 1.3360~
| Level | Comment | Level | Comment | |||||
|---|---|---|---|---|---|---|---|---|
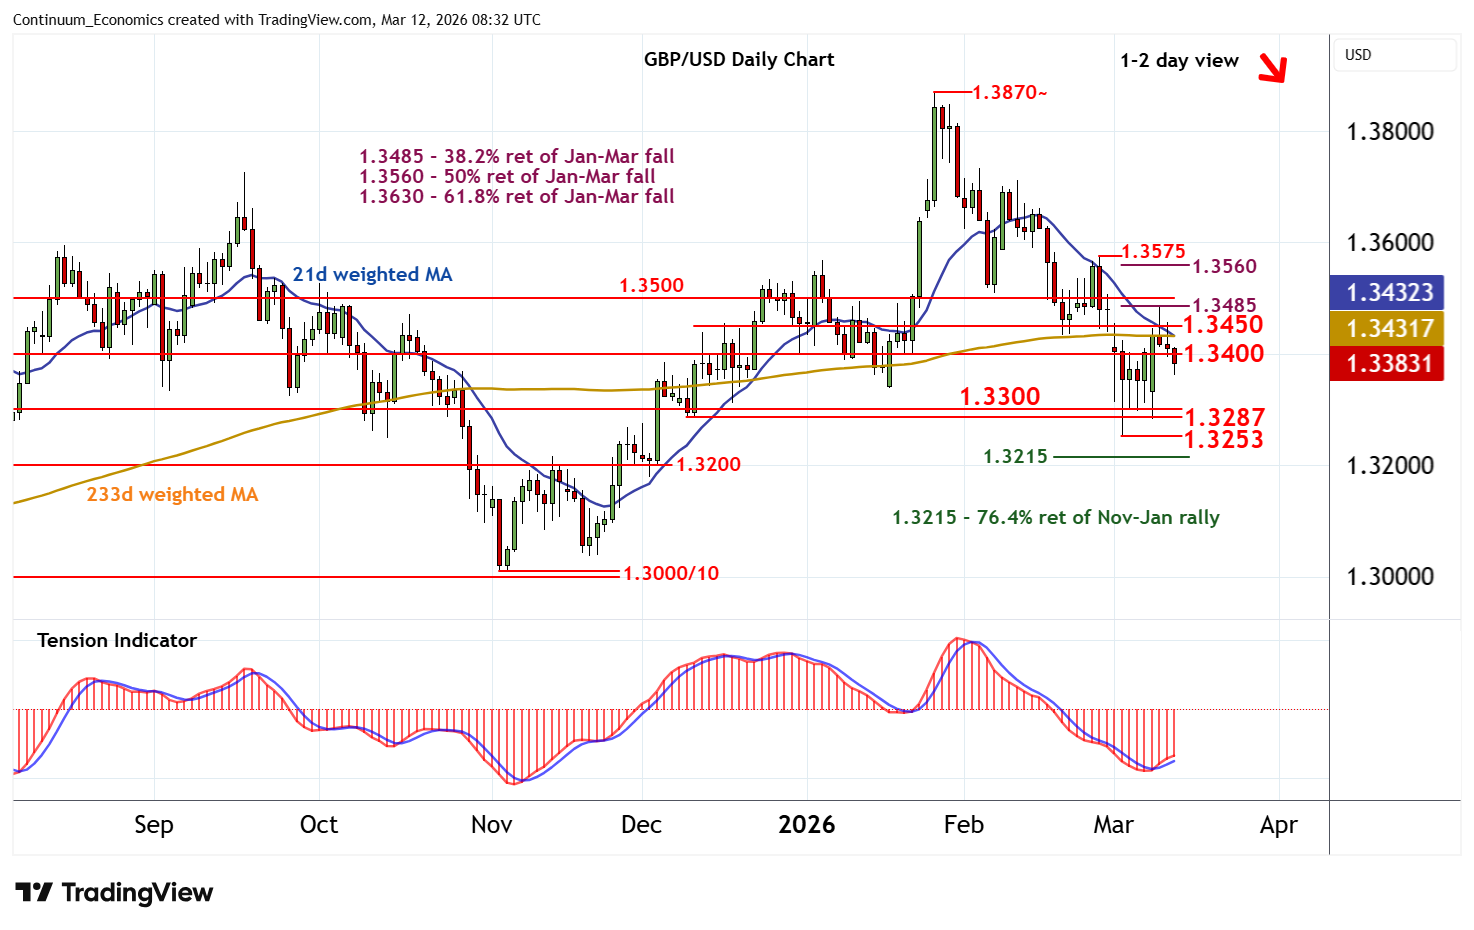
| R4 | 1.3500 | ** | congestion | S1 | 1.3300 | * | congestion | |
| R3 | 1.3485 | * | 38.2% ret of Jan-Mar fall | S2 | 1.3287 | * | 9 Dec (w) low | |
| R2 | 1.3450 | ** | congestion | S3 | 1.3253 | ** | 3 Mar YTD low | |
| R1 | 1.3400 | ** | congestion | S4 | 1.3215 | ** | 76.4% ret of Nov-Jan rally |
Asterisk denotes strength of level
08:10 GMT - Consolidation above 1.3400 has given way to a test lower to 1.3360~, where flattening oversold intraday studies are prompting short-term consolidation. Daily readings have turned mixed/negative and broader weekly charts are bearish, highlighting room for further losses in the coming sessions. Focus is expected to turn to the 1.3287 weekly low of 9 December and further congestion around 1.3300. But a close below the 1.3253 current year low of 3 March is needed to turn sentiment negative and extend late-January losses towards the 1.3215 Fibonacci retracement. Meanwhile, a close back above 1.3400 will help to stabilise price action and give way to fresh consolidation beneath further congestion around 1.3450.