Published: 2025-11-19T12:50:42.000Z
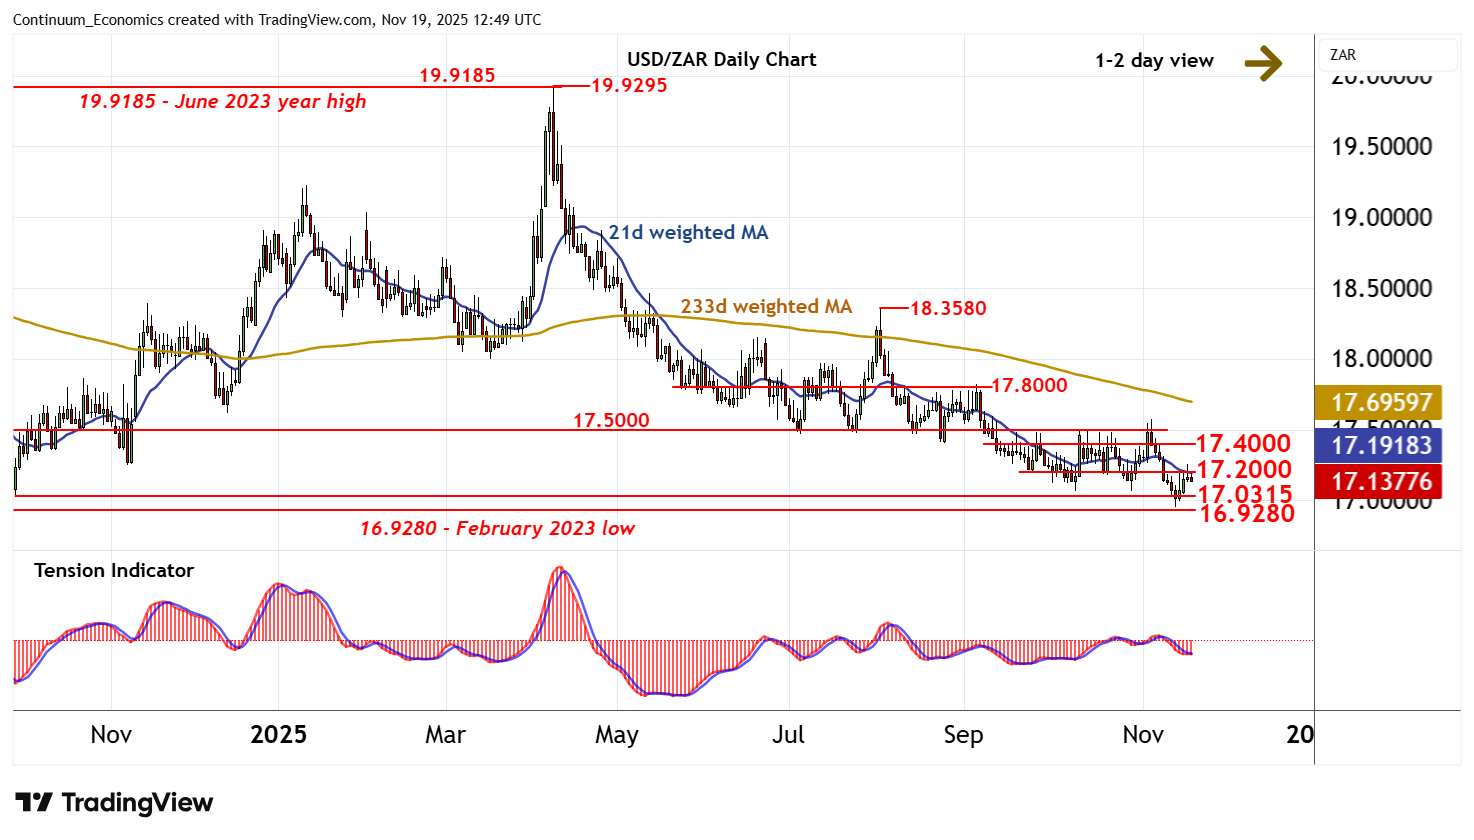
Chart USD/ZAR Update: Back in range
1
The test above congestion resistance at 17.2000 has not been sustained
| Level | Comment | Level | Comment | |||||
|---|---|---|---|---|---|---|---|---|
| R4 | 17.5625 | ** | 38.2% ret of Aug-Oct fall | S1 | 17.0315 | ** | 30 Sep 2024 (y) low | |
| R3 | 17.5000 | ** | congestion | S2 | 17.0000 | ** | congestion | |
| R2 | 17.4000 | * | congestion | S3 | 16.9495 | ** | 13 Nov YTD low | |
| R1 | 17.2000 | * | congestion | S4 | 16.9280 | February 2023 low |
Asterisk denotes strength of level
12:10 GMT - The test above congestion resistance at 17.2000 has not been sustained, as intraday studies turn down, with prices currently trading around 17.1400. A drift down towards critical support within 16.9280 - 17.0315 cannot be ruled out. But mixed/positive daily readings are expected to limit any initial tests in fresh consolidation. Broader weekly charts are under pressure, but a close beneath here is needed to turn sentiment negative and confirm continuation of May 2023 losses. Meanwhile, any renewed tests above 17.2000 should be limited in fresh selling interest towards congestion around 17.4000.