Chart USD/CAD Update: Corrective bounce in CAD-driven trade

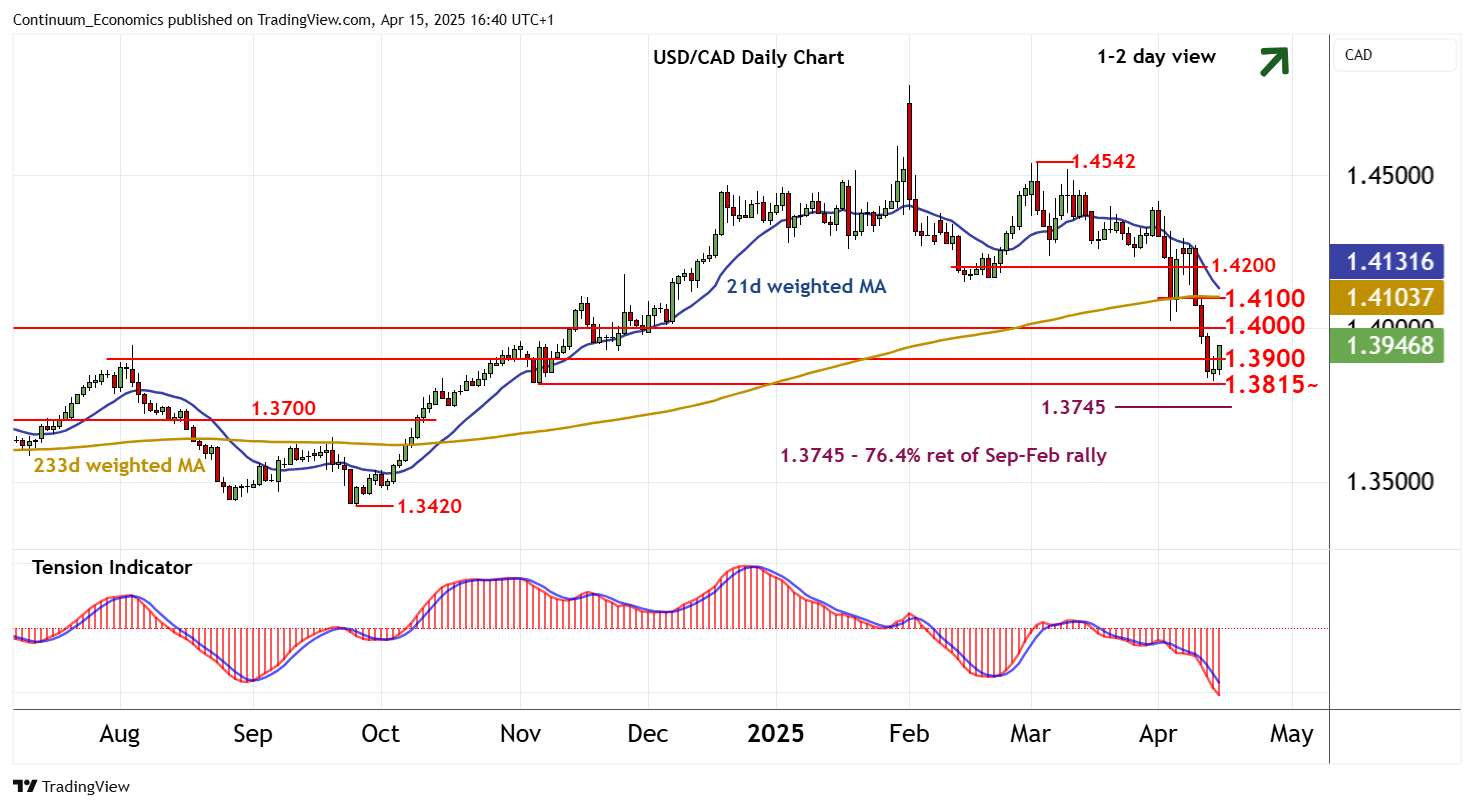
Consolidation following the bounce from the 1.3828 current year low of 14 April is giving way to a test higher in CAD-driven trade
| Levels | Imp | Comment | Levels | Imp | Comment | |||
|---|---|---|---|---|---|---|---|---|
| R4 | 1.4300 | ** | break level | S1 | 1.3900 | * | congestion | |
| R3 | 1.4200 | congestion | S2 | 1.3828 | * | 14 Apr YTD low | ||
| R2 | 1.4100 | break level | S3 | 1.3815 | ** | 6 Nov (m) low | ||
| R1 | 1.4000 | * | break level | S4 | 1.3745 | ** | 76.4% ret of Sep-Feb rally |
Asterisk denotes strength of level
16:30 BST - Consolidation following the bounce from the 1.3828 current year low of 14 April is giving way to a test higher in CAD-driven trade, with prices currently trading around 1.3940. Rising intraday studies and a tick higher in oversold daily stochastics highlight room for a test of resistance at the 1.4000 break level. But the negative daily Tension Indicator and mixed/negative weekly charts are expected to limit any further gains beyond here in renewed selling interest towards 1.4100. Meanwhile, support is raised to 1.3900 and extends down to the 1.3815 monthly low of 6 November. A close beneath here is needed to turn sentiment negative once again and extend February losses towards the 1.3745 Fibonacci retracement.