Published: 2025-08-21T05:17:39.000Z
Chart USD/TWD Update: Extend corrective gains
0
-
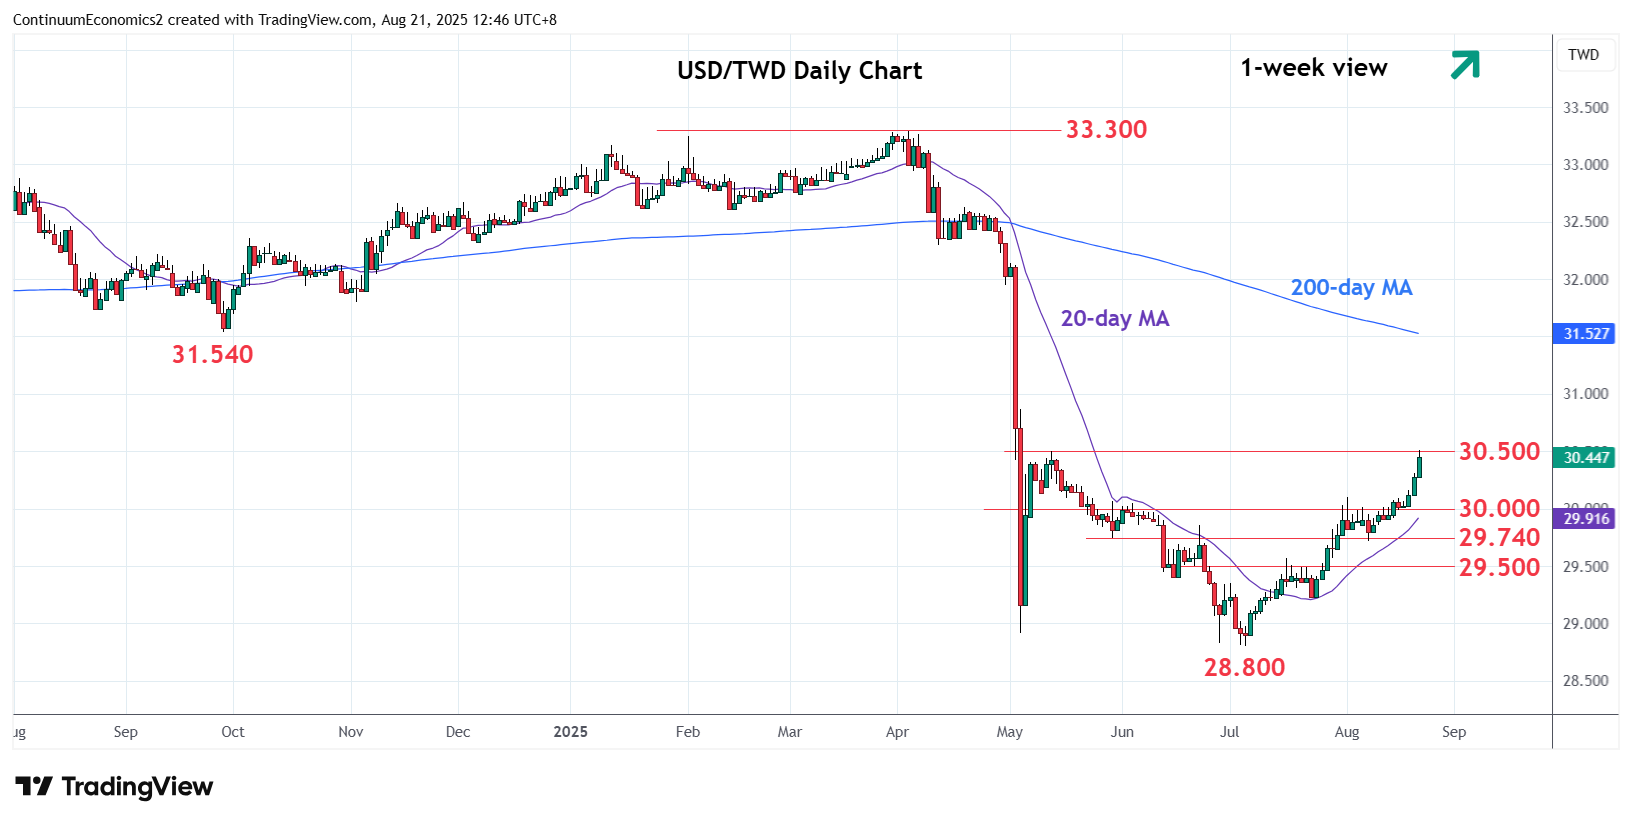
Break of the 30.000/30.100 area further extend gains from the 28.800 July current year low to reach resistance at 30.500
| Levels | Imp | Comment | Levels | Imp | Comment | |||
|---|---|---|---|---|---|---|---|---|
| R4 | 31.050 | * | 50% Apr/Jul fall | S1 | 30.100 | ** | 1 Aug high | |
| R3 | 31.000 | ** | figure | S2 | 30.000 | * | congestion | |
| R2 | 30.870 | * | 5 May high | S3 | 29.720 | ** | 7 Aug low | |
| R1 | 30.500 | ** | 13 May high, 38.2% | S4 | 29.500 | * | congestion |
05:10 GMT - Break of the 30.000/30.100 area further extend gains from the 28.800 July current year low to reach resistance at 30.500 level and 38.2% Fibonacci level. Break here, if seen, will further retrace the April/July losses and see room to the 30.870 resistance and 31.000 figure. However, gains are seen corrective and expected to give way to fresh selling pressure later. Meanwhile, support is raised to the 30.100/30.000 area and see break here needed to fade the upside pressure and see deeper pullback 29.700 support and 29.500 congestion.