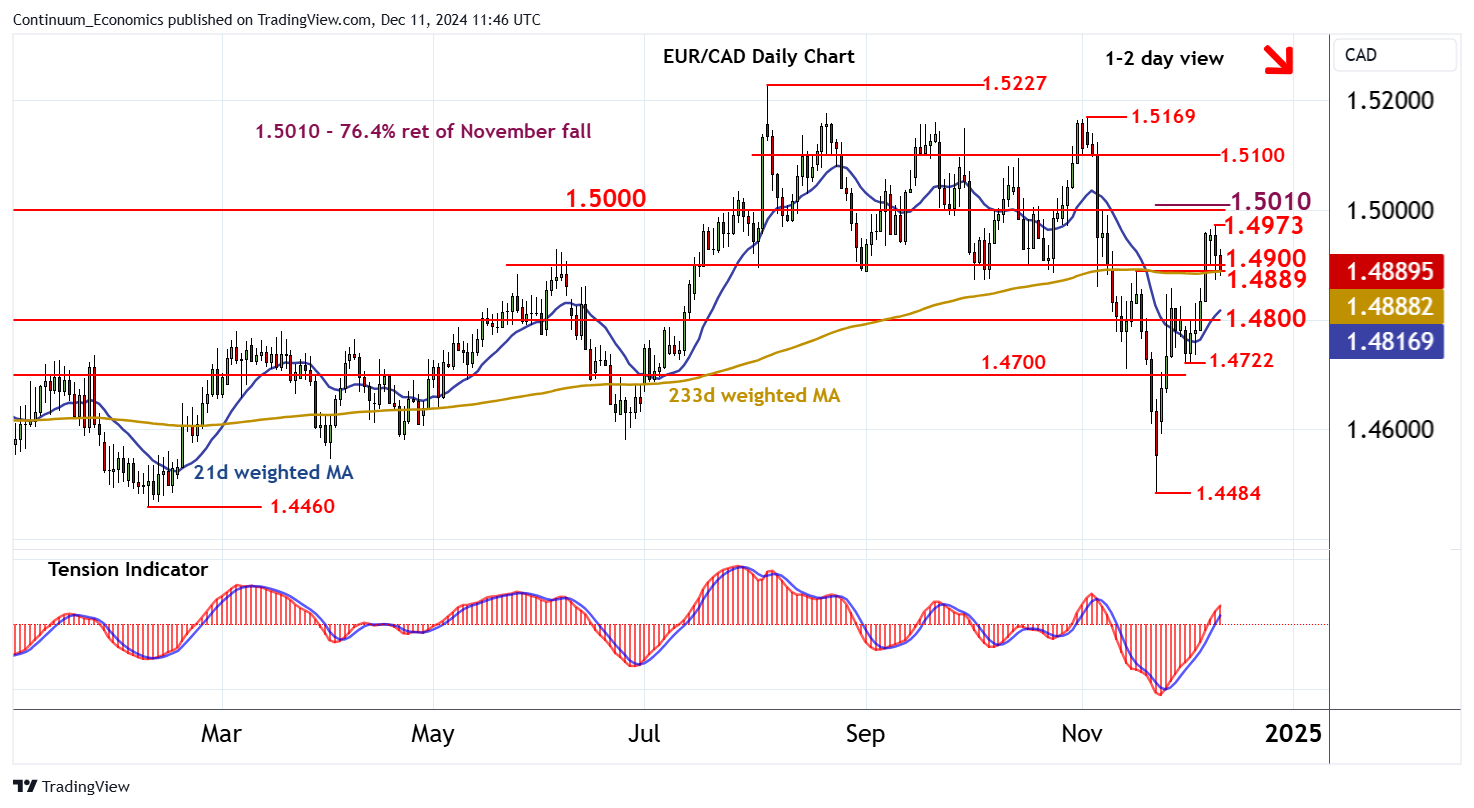
Chart EUR/CAD Update: Under pressure

Little change, as choppy trade extends pressure on support within the 1.4900 break level and the 1.4889 weekly high of 18 November

| Level | Comment | Level | Comment | |||||
|---|---|---|---|---|---|---|---|---|
| R4 | 1.5100 | * | break level | S1 | 1.4900 | ** | break level | |
| R3 | 1.5010 | ** | 76.4% ret of Nov fall | S2 | 1.4889 | ** | 18 Nov (w) high | |
| R2 | 1.5000 | ** | congestion | S3 | 1.4800 | * | congestion | |
| R1 | 1.4973 | * | 10 Dec high | S4 | 1.4722 | ** | 2 Dec (w) low |
Asterisk denotes strength
11:20 GMT - Little change, as choppy trade extends pressure on support within the 1.4900 break level and the 1.4889 weekly high of 18 November. Intraday studies have turned down and overbought daily stochastics are unwinding, highlighting room for a later break. Focus will then turn to congestion around 1.4800, but the rising daily Tension Indicator and improving weekly charts could promote fresh buying interest towards here. Meanwhile, resistance is at the 1.4973 high of 10 December. A close above here, if seen, would turn sentiment positive and extend November gains towards further resistance at congestion around 1.5000 and the 1.5010 Fibonacci retracement. However, already overbought daily stochastics are expected to limit any initial tests of this area in profit-taking/consolidation.