Published: 2025-12-10T00:56:55.000Z
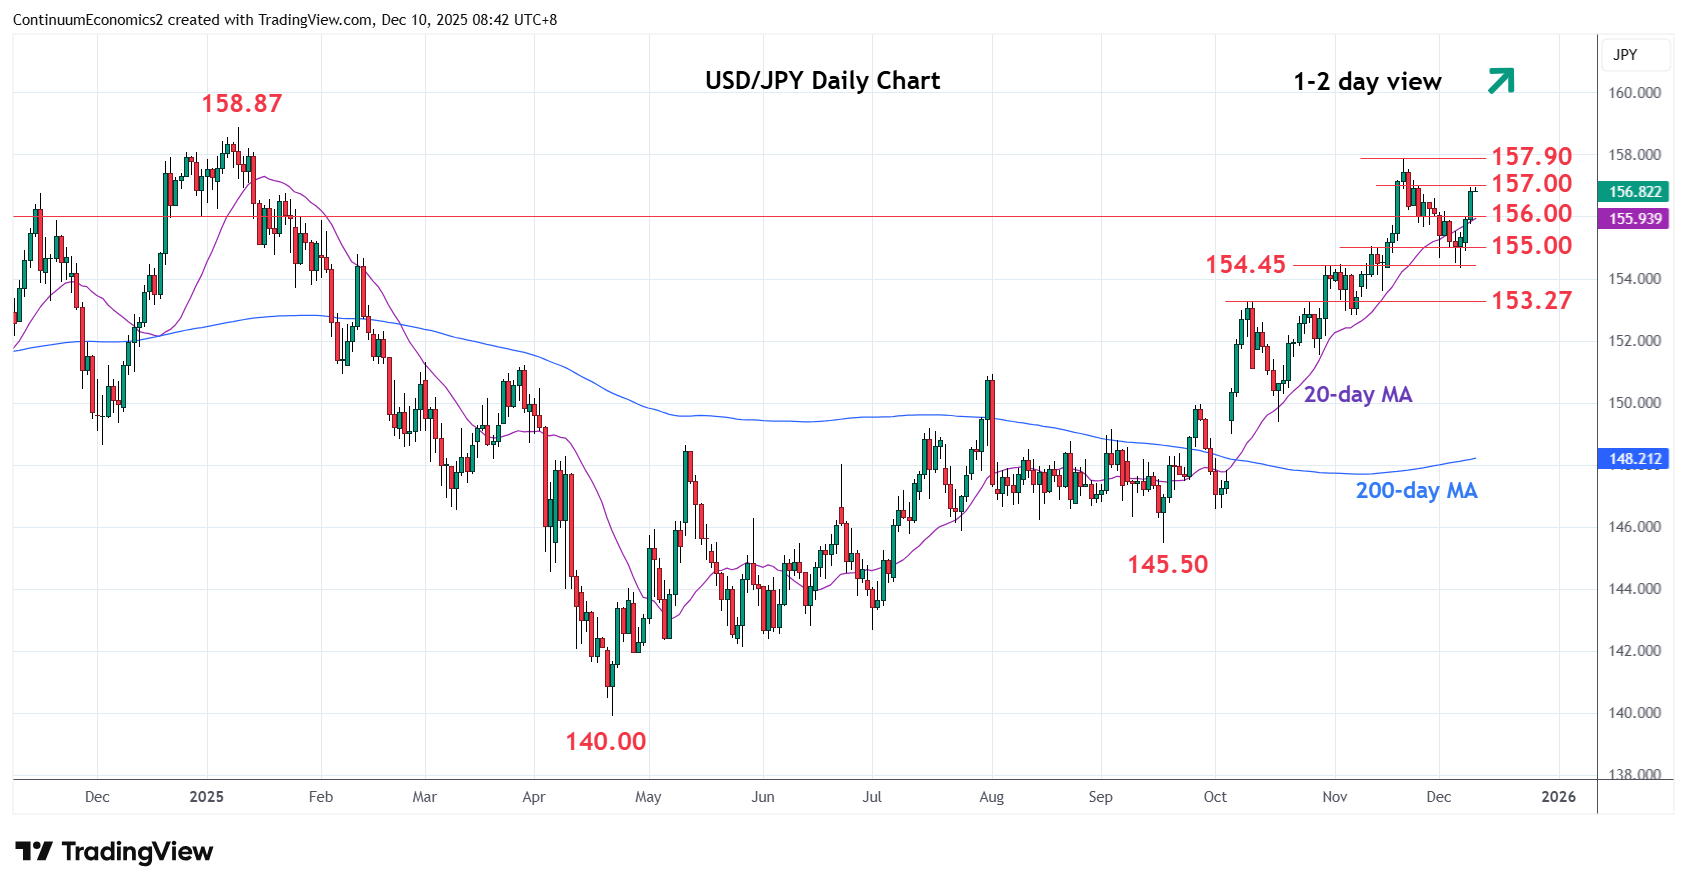
Chart USD/JPY Update: Extending gains from 155.00/154.45 support
-
Consolidation at the 156.00 level has given way to break to reach the 157.00 level
| Levels | Imp | Comment | Levels | Imp | Comment | |||
|---|---|---|---|---|---|---|---|---|
| R4 | 160.00 | * | figure | S1 | 156.00 | * | congestion | |
| R3 | 158.87 | ** | 10 Jan YTD high | S2 | 155.00 | * | congestion | |
| R2 | 157.90/00 | ** | 20 Nov high, congestion | S3 | 154.45 | ** | 30 Oct high | |
| R1 | 157.00 | * | congestion | S4 | 154.00 | congestion |
Asterisk denotes strength of level
00:50 GMT - Consolidation at the 156.00 level has given way to break to extend bounce from support at the 155.00/154.45 area to reach the 157.00 level. Pause here see prices unwinding overbought intraday studies but a later break here cannot be ruled out as daily studies continue to track higher. Clearance here will expose the 157.90 high to retest where reaction here can be expected. Break, if seen, will return focus to 158.87, 10 January YTD high. Meanwhile, support at the 156.00 level now underpin. Would take break here to open up room for retest of the 155.00/154.45 area.