Chart USD/CAD Update: Test of 1.3800 not sustained

The test of congestion resistance at 1.3800 is giving way to anticipated reactions
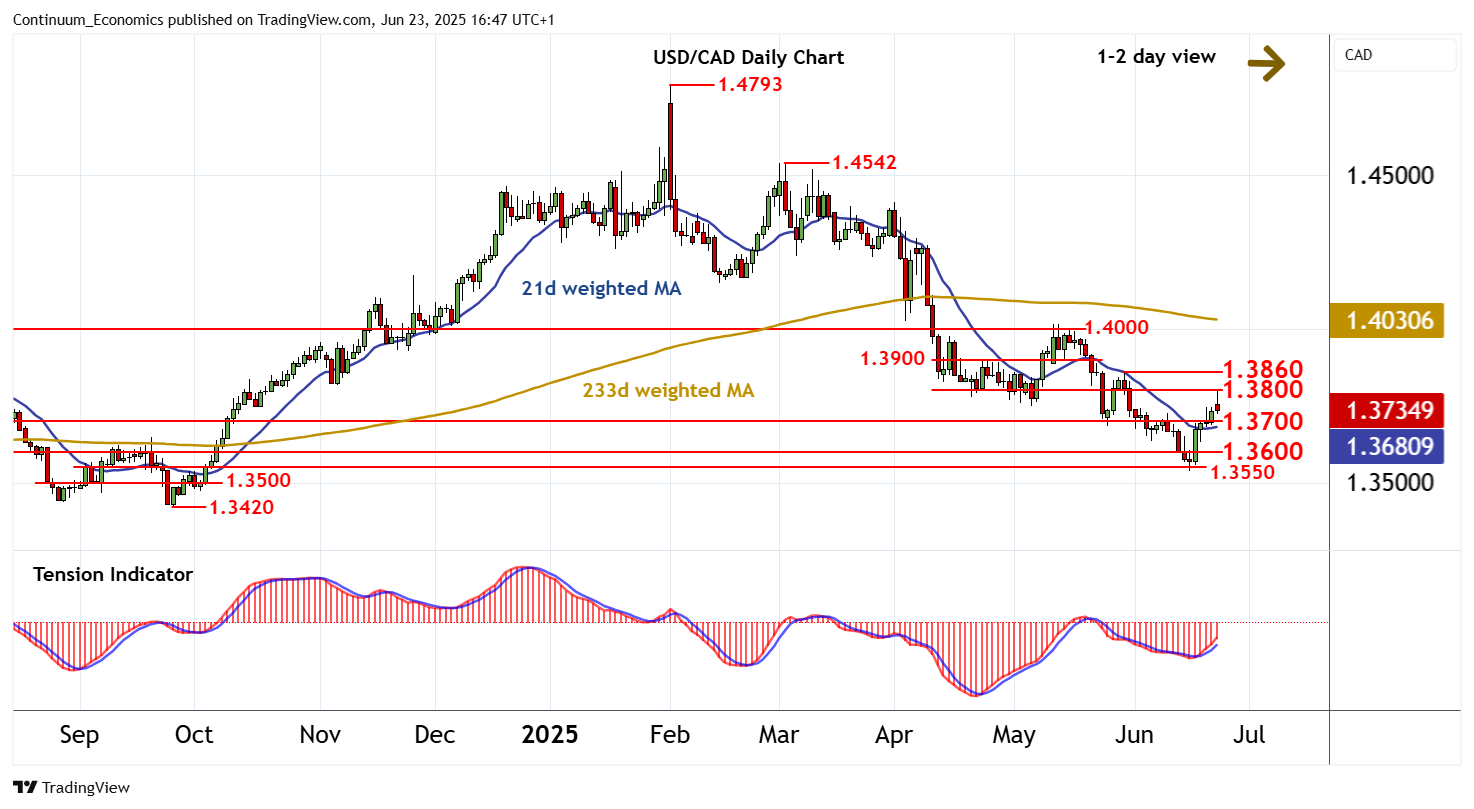
| Levels | Imp | Comment | Levels | Imp | Comment | |||
|---|---|---|---|---|---|---|---|---|
| R4 | 1.4000 | ** | congestion | S1 | 1.3700 | ** | congestion | |
| R3 | 1.3900 | * | congestion | S2 | 1.3600 | ** | congestion | |
| R2 | 1.3860 | * | 29 May (w) high | S3 | 1.3550 | * | congestion | |
| R1 | 1.3800 | congestion | S4 | 1.3500 | * | congestion |
Asterisk denotes strength of level
16:35 BST - The test of congestion resistance at 1.3800 is giving way to anticipated reactions, as overbought intraday studies unwind, with prices falling sharply to currently trade around 1.3730. Overbought daily stochastics are also flattening, suggesting potential for a test of congestion support at 1.3700. But the rising daily Tension Indicator and positive weekly charts are expected to limit any break in renewed buying interest above further congestion around 1.3600. Following corrective trade, fresh gains are looked for, with a later break above 1.3800 improving price action and opening up the 1.3860 weekly high of 29 May.