Chartbook: US Chart 10 Year Yield: Choppy in range - critical support at 3.670%

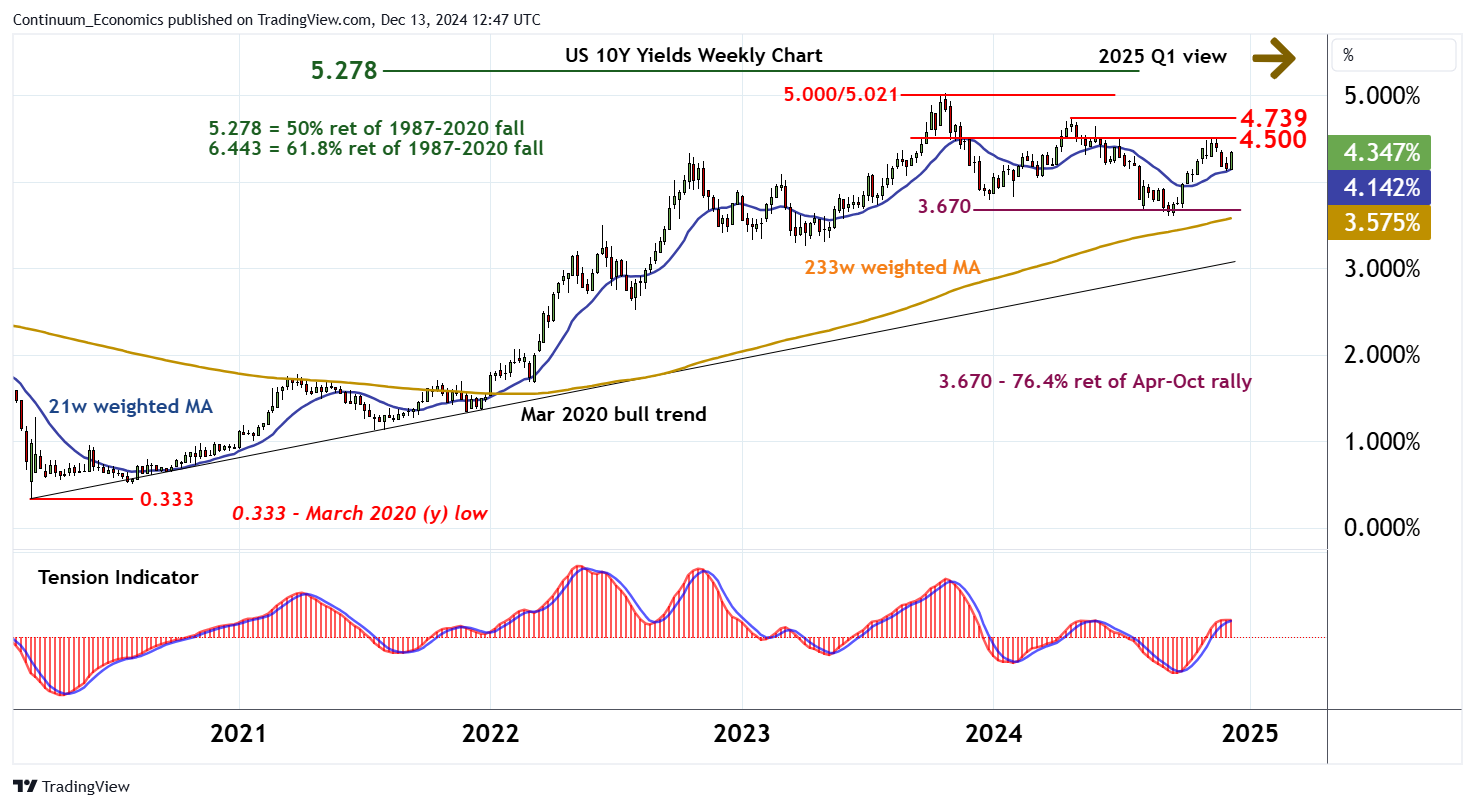
The test of critical support at the 3.670% Fibonacci retracement has given way to a steady bounce
The test of critical support at the 3.670% Fibonacci retracement has given way to a steady bounce,

with yield prices reaching resistance at 4.500% before settling back.
Focus is turning back to 4.500%, but negative weekly stochastics and a tick lower in the flat weekly Tension Indicator are expected to limit any break in renewed consolidation beneath the 4.739% current year high of 25 April. Continuation beyond here, however, would improve price action and extend September gains towards critical resistance at the 5.000%/5.021%.
An unexpected break would confirm continuation of the March 2020 bull trend and progressively more expensive yield prices.
Meanwhile, support is at congestion around 4.000%.

Following any corrective gains, a break back beneath here is looked for.
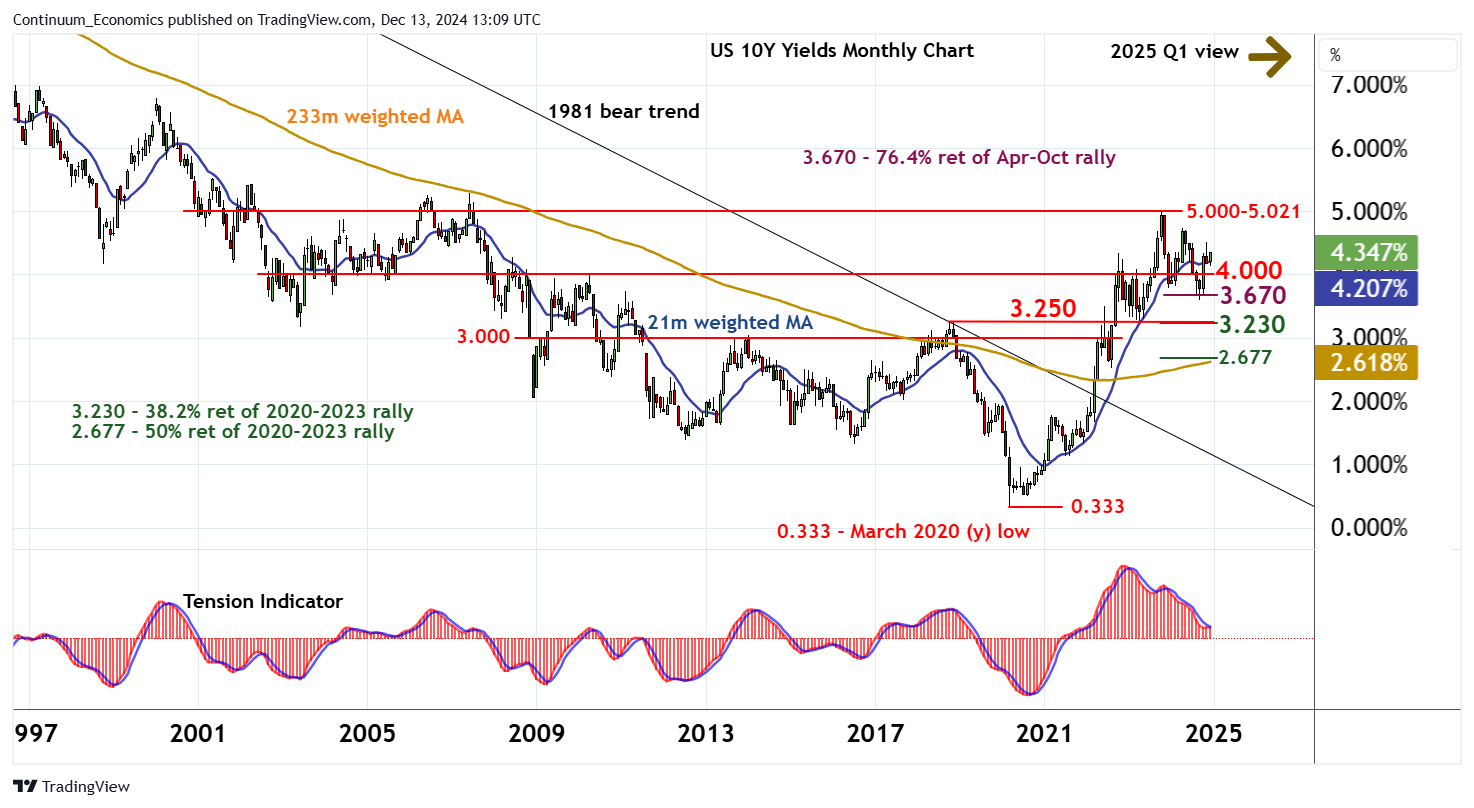
Focus will then turn to critical support at 3.670%, where mixed/positive monthly studies could prompt fresh consolidation.
Longer-term charts are deteriorating, however, highlighting room for a later break beneath here. This will confirm a significant top in place at 5.000%/5.021% and complete a multi-month distribution top, as a deeper correction of the rally from the 0.333% all-time low of March 2020 develops. Strong support within the 3.250% year high of October 2018 and the 2.230% retracement will initially attract.