Chart USD/ZAR Update: Consolidating test of strong support - studies under pressure

The anticipated test of strong support at the 18.2960 current year low of 24 January is giving way to expected consolidation
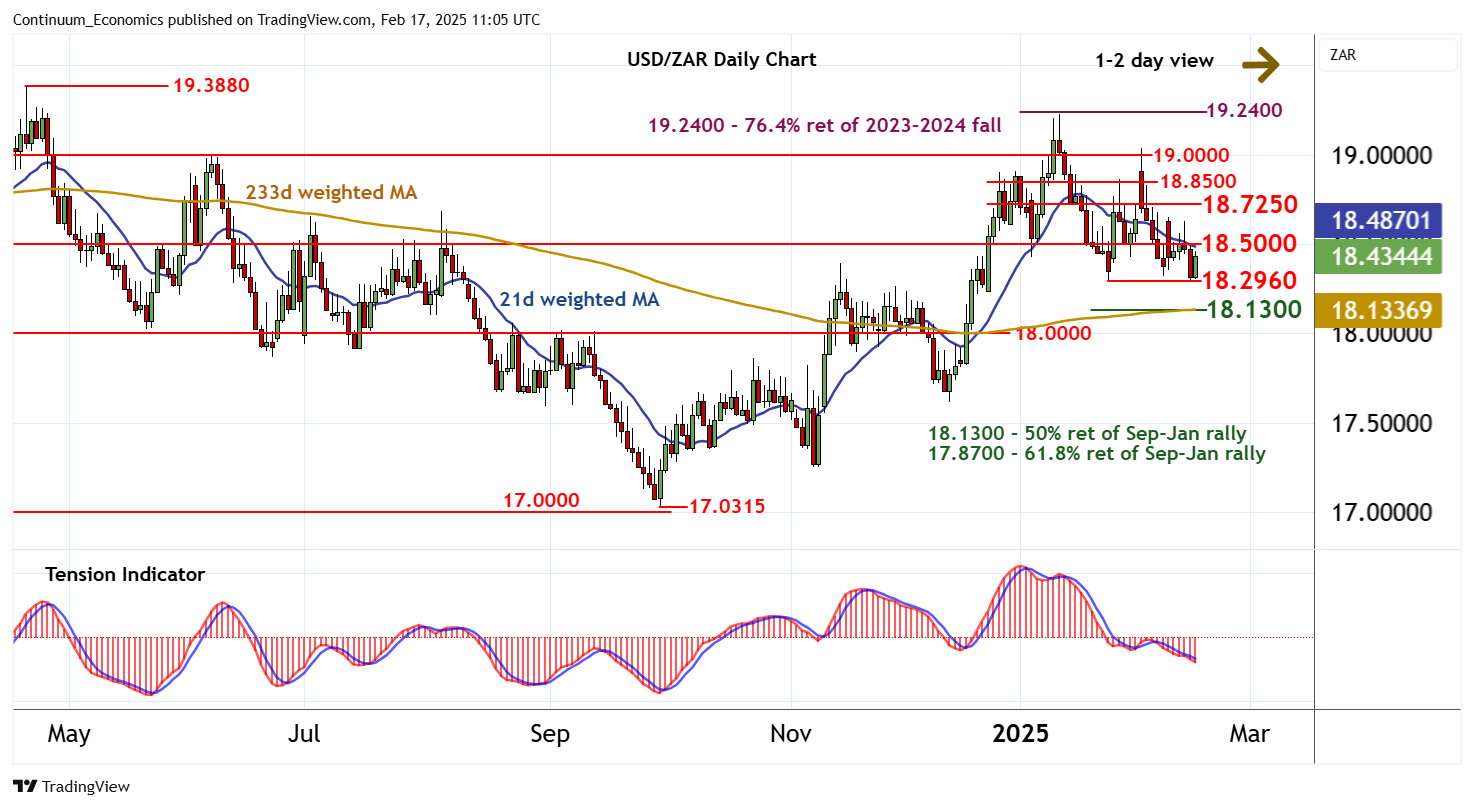
| Level | Comment | Level | Comment | |||||
|---|---|---|---|---|---|---|---|---|
| R4 | 19.0000 | ** | congestion | S1 | 18.2960 | * | 24 Jan YTD low | |
| R3 | 18.8500 | break level | S2 | 18.1300 | * | 50% ret of Sep-Jan rally | ||
| R2 | 18.7250 | * | congestion | S3 | 18.0000 | ** | congestion | |
| R1 | 18.5000 | ** | break level | S4 | 17.8700 | ** | 61.8% ret of Sep-Jan rally |
Asterisk denotes strength of level
11:00 GMT - The anticipated test of strong support at the 18.2960 current year low of 24 January is giving way to expected consolidation, as oversold intraday studies unwind, with prices currently trading around 18.4350. Focus is turning to resistance at 18.5000, but daily readings have turned down and broader weekly charts remain under pressure, suggesting any break above here could meet renewed selling interest towards congestion around 18.7250. Following cautious trade, fresh losses are looked for. But a close below 18.2960 is needed to add weight to sentiment and extend January losses initially to the 18.1300 Fibonacci retracement.