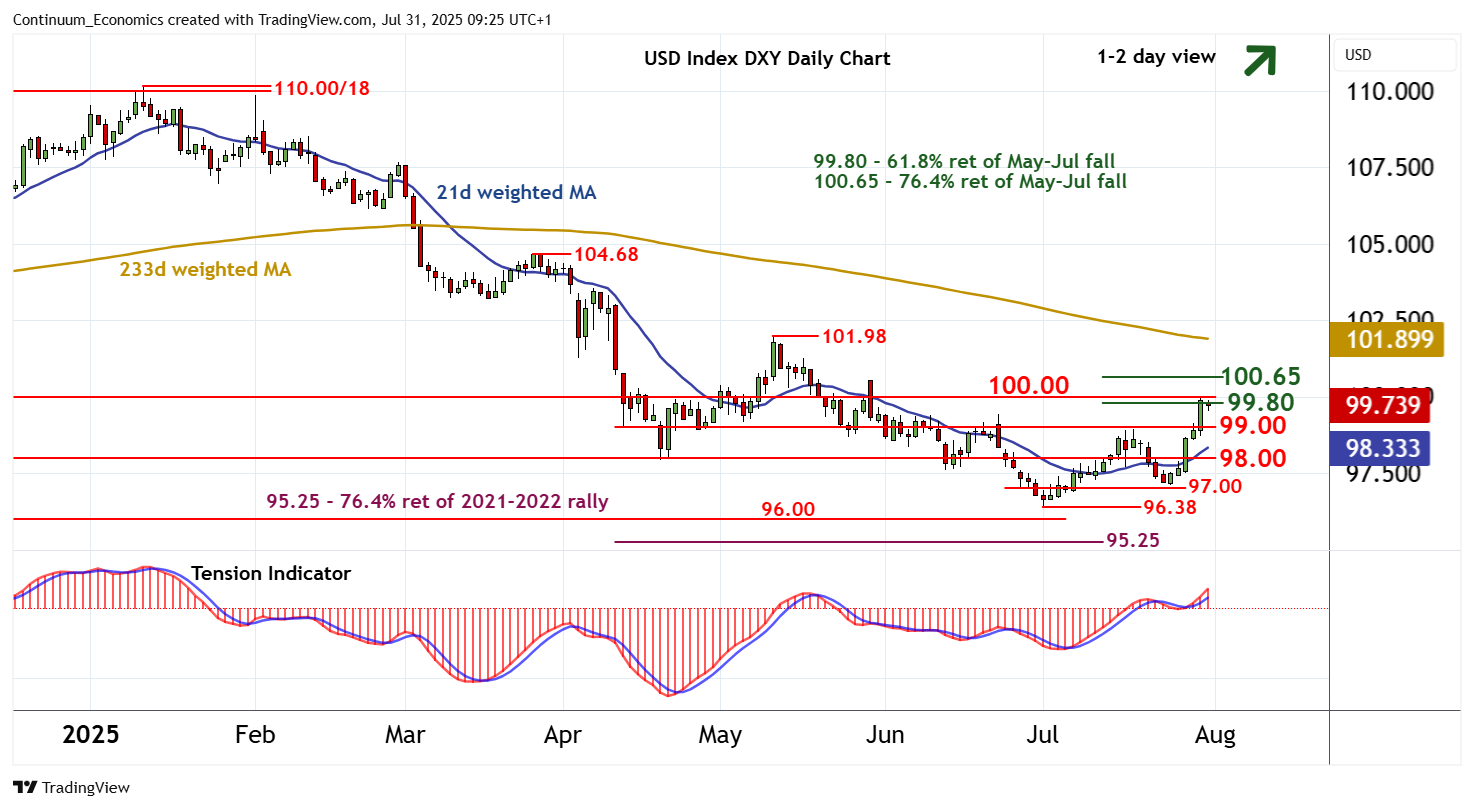
Chart USD Index DXY Update: Studies continue to rise

Anticipated gains have reached resistance at the 99.80 Fibonacci retracement and congestion around 100.00
| Levels | Imp | Comment | Levels | Imp | Comment | |||
|---|---|---|---|---|---|---|---|---|
| R4 | 101.00 | congestion | S1 | 99.00 | * | break level | ||
| R3 | 100.65 | ** | 76.4% ret of May-Jul fall | S2 | 98.00 | * | congestion | |
| R2 | 100.54 | ** | 29 May (w) high | S3 | 97.00 | * | congestion | |
| R1 | 99.80/00 | ** | 61.8% ret; congestion | S4 | 96.50 | * | congestion |
Asterisk denotes strength of level
09:15 BST - Anticipated gains have reached resistance at the 99.80 Fibonacci retracement and congestion around 100.00, where unwinding negative divergence on intraday studies and flattening overbought daily stochastics are prompting short-term reactions. The daily Tension Indicator continues to rise and broader weekly charts are improving, highlighting room for still further gains in the coming sessions. A later close above 99.80/00 will open up the 100.65 retracement. But overbought daily stochastics could limit any initial tests in consolidation. Meanwhile, support is raised to 99.00. A close beneath here, if seen, will turn sentiment neutral and prompt consolidation above congestion support at 98.00.