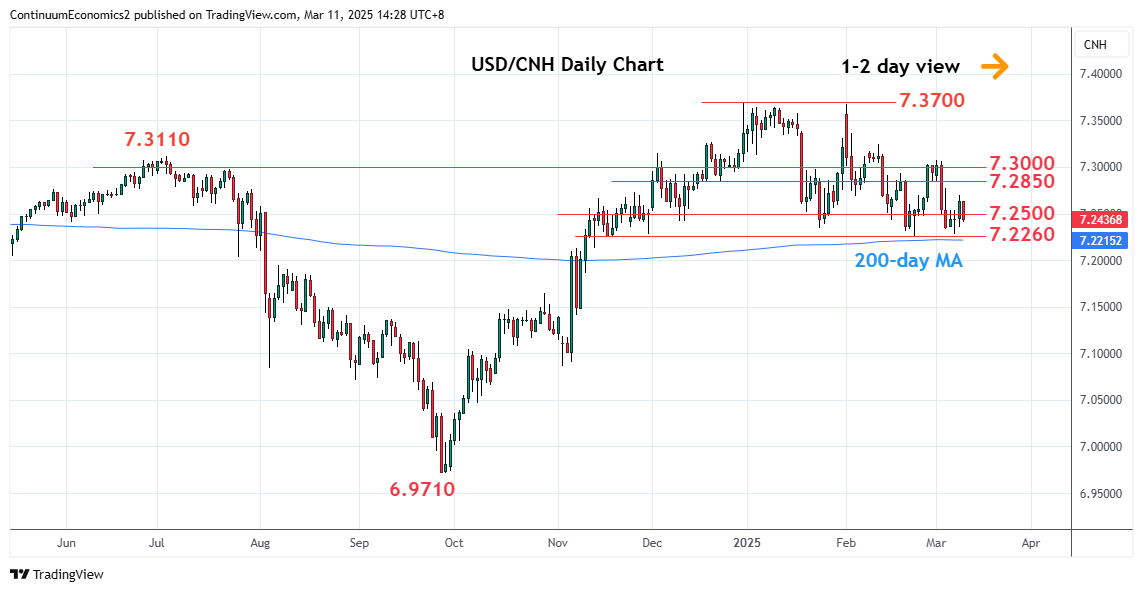
Bounce from the 7.2260 support has seen gains checked at the 7.2700 resistance

| Level | Imp | Comment | Level | Imp | Comment | |||
|---|---|---|---|---|---|---|---|---|
| R4 | 7.3250 | * | 12 Feb high | S1 | 7.2260 | ** | 24 Feb YTD low | |
| R3 | 7.3070 | ** | 3 Mar high | S2 | 7.2175 | * | 38.2% Sep/Dec rally | |
| R2 | 7.2850 | * | congestion | S3 | 7.2000 | * | congestion | |
| R1 | 7.2700 | * | congestion | S4 | 7.1860 | * | 11 Nov low |
Asterisk denotes strength of level
06:55 GMT - Bounce from the 7.2260 support has seen gains checked at the 7.2700 resistance with the resulting bear flag suggesting consolidation giving way to fresh selling pressure later. Break of the 7.2345 and 7.2260 lows will confirm a double top at the December/February highs and open up room for deeper pullback to retrace the September/December rally. Lower will see room to the 38.2% Fibonacci level at 7.2175 then the 7.2000 congestion. Meanwhile, resistance at 7.2700 and extending to the 7.2850 congestion expected to cap and sustain the broader losses from the 7.3700 high