Published: 2026-03-25T06:32:38.000Z
Chart GBP/JPY Update: Retest 213.30 resistance
1
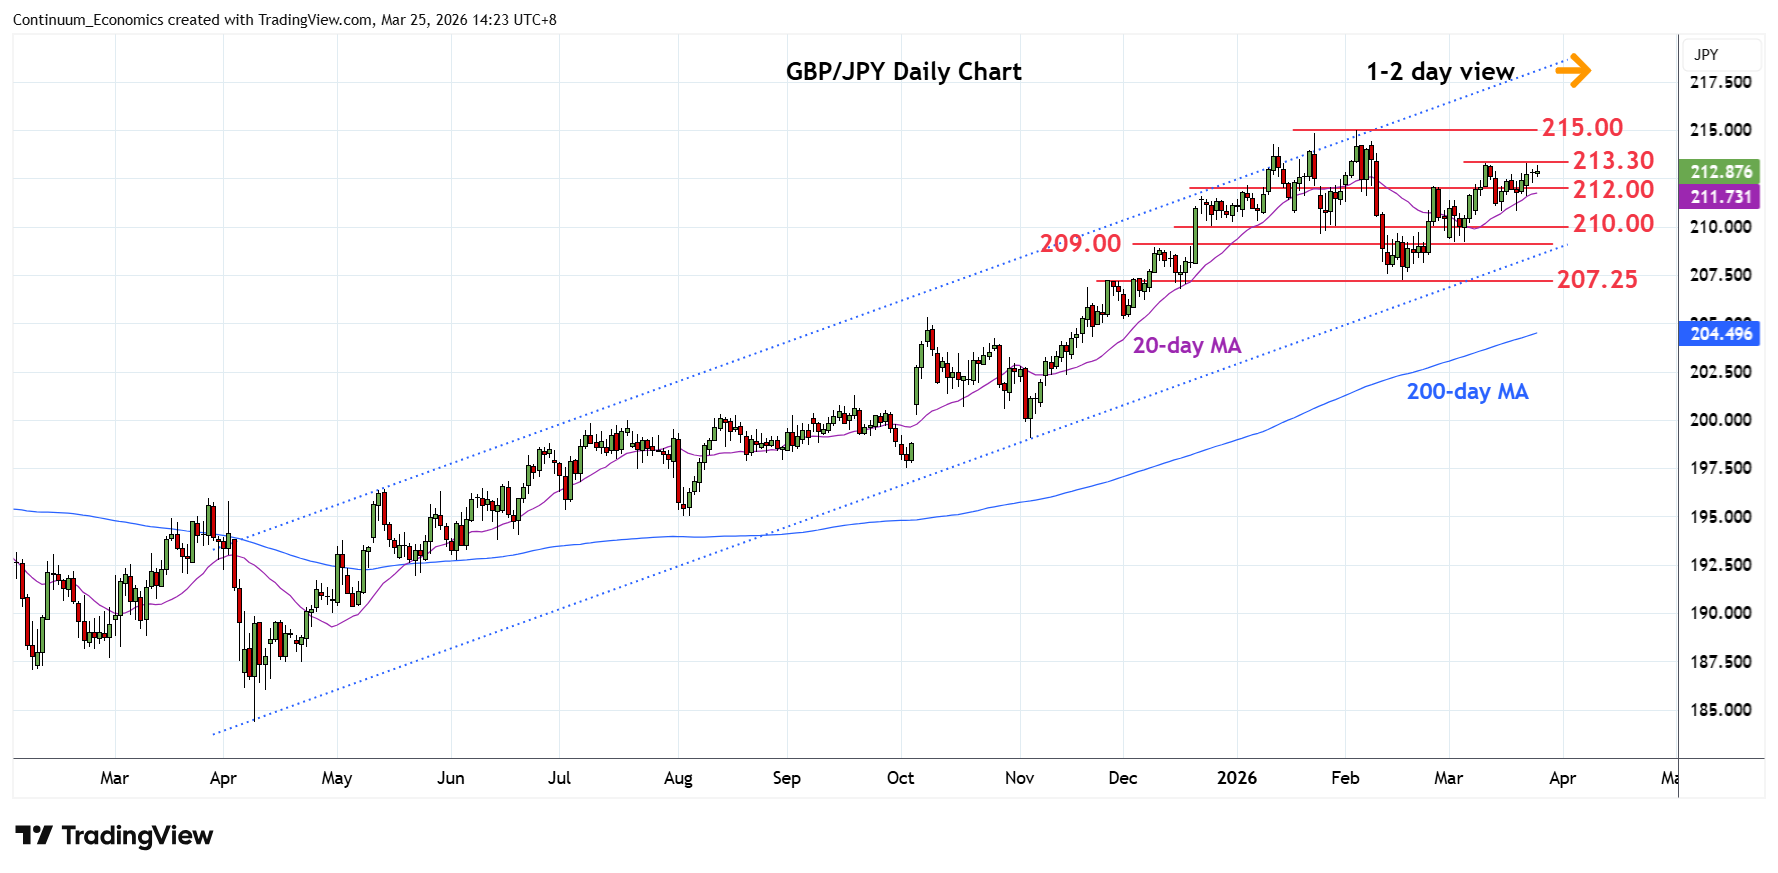
Return to pressure resistance at the 213.30 11 March high following bounce from the 210.80 low of last week
| Levels | Imp | Comment | Levels | Imp | Comment | |||
|---|---|---|---|---|---|---|---|---|
| R4 | 215.90 | * | Jul 2008 high | S1 | 212.00 | * | congestion | |
| R3 | 215.00 | ** | 4 Feb YTD high | S2 | 210.80 | * | 16 Mar low | |
| R2 | 214.00 | * | congestion | S3 | 210.00 | * | congestion | |
| R1 | 213.30 | ** | 11 Mar high | S4 | 209.20/00 | * | 3 Mar low, congestion |
Asterisk denotes strength of level
06:30 GMT - Return to pressure resistance at the 213.30 11 March high following bounce from the 210.80 low of last week. Positive daily studies suggest scope for break here to open up room for extension to resistance at 214.00 congestion and 215.00, February current year high. However, mixed weekly studies suggest this area expected to cap gains. Meanwhile, support is raised to the 212.00 congestion ahead of 210.80 low of last week. Break here will return focus to the downside to retrace gains from the 207.25 February low.