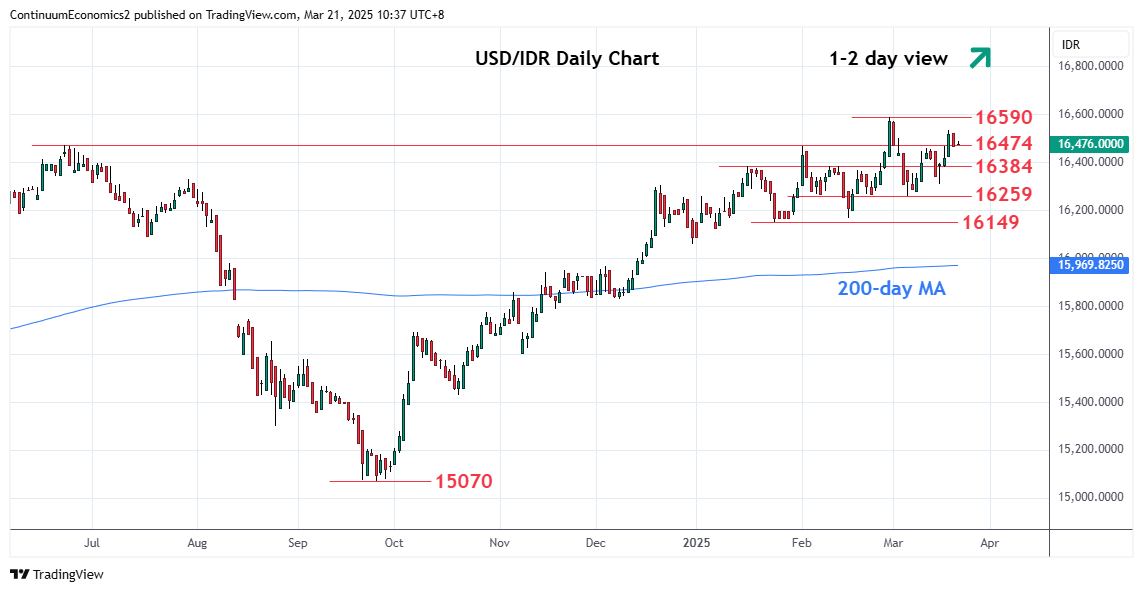
Break above the 16470/16474 resistance has seen extension to reach 16535 high

| Levels | Imp | Comment | Levels | Imp | Comment | |||
|---|---|---|---|---|---|---|---|---|
| R4 | 16800 | ** | Jun 1998 all-time high | S1 | 16384 | * | Jan high | |
| R3 | 16625 | ** | Mar 2020 year high | S2 | 16309 | * | 17 Mar low | |
| R2 | 16590 | ** | 28 Feb YTD high | S3 | 16259 | ** | 6 Mar low | |
| R1 | 16535 | * | 19 Mar high | S4 | 16149 | * | 24 Jan low |
Asterisk denotes strength of level
02:50 GMT - Break above the 16470/16474 resistance has seen extension to reach 16535 high. Break here will expose the 16590 February YTD high to retest. Clearance here, if seen, will extend the underlying bull trade but divergence on weekly studies suggest the latter likely to cap. Meanwhile, support is raised to the 16384 high of January which now underpin. Would take break here to expose strong support at the 16309 and 16259 higher lows to retest. These are seen protecting the downside and only break here will open up room for deeper pullback.