Published: 2025-09-15T02:54:34.000Z
Chart USD/THB Update: Consolidating at 31.58 low
0
-
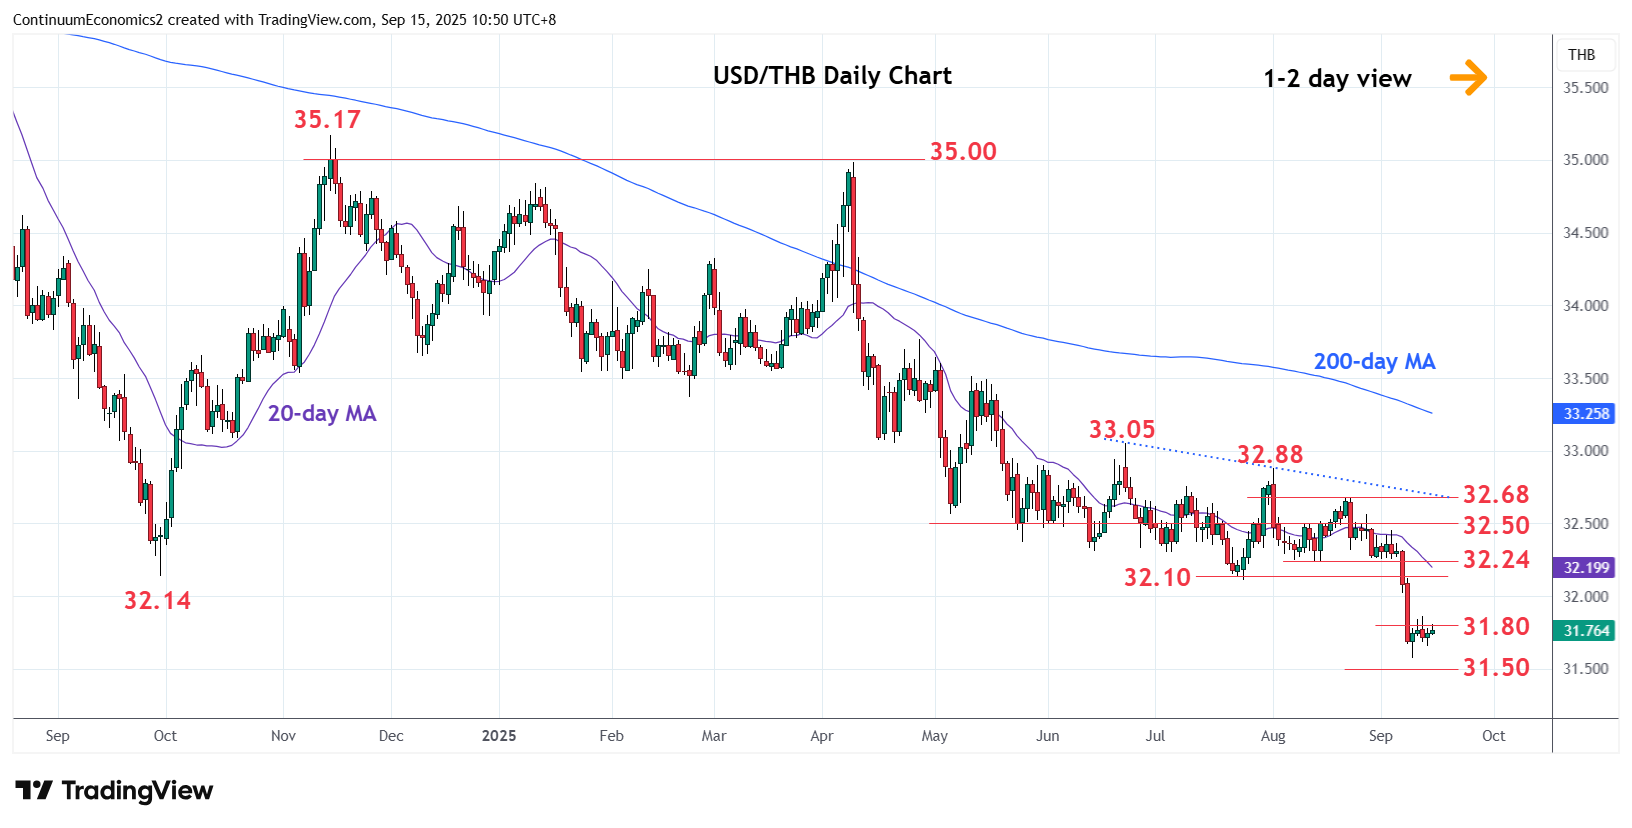
Little change, as prices extend consolidation above the 31.58 current year low
| Level | Comment | Level | Comment | |||||
|---|---|---|---|---|---|---|---|---|
| R4 | 32.40/50 | * | congestion | S1 | 31.58 | ** | 9 Sep YTD low | |
| R3 | 32.24 | * | Aug low | S2 | 31.50 | * | congestion | |
| R2 | 32.10/14 | ** | Jul, 2024 year lows | S3 | 31.20 | * | congestion | |
| R1 | 31.80 | * | congestion | S4 | 31.05 | * | Jun 2021 low |
Asterisk denotes strength of level
02:50 GMT - Little change, as prices extend consolidation above the 31.58 current year low. However, shallow bounce here keeps pressure on the downside and see risk for break to extend losses from the September 2022 year high. Break here and the 31.50 congestion will see extension to the 31.20 congestion and 31.05, June 2021 low. Would expect reaction at the latter as daily studies push deep into oversold areas. Meanwhile, resistance is at 31.80 and this extend to 32.10/32.14, the July and 2024 year lows. These are expected to cap and sustain losses from the 35.00, April current year high.