Chart EUR/CAD Update: Extending consolidation at multi-year resistances
Still little change, as prices extend consolidation
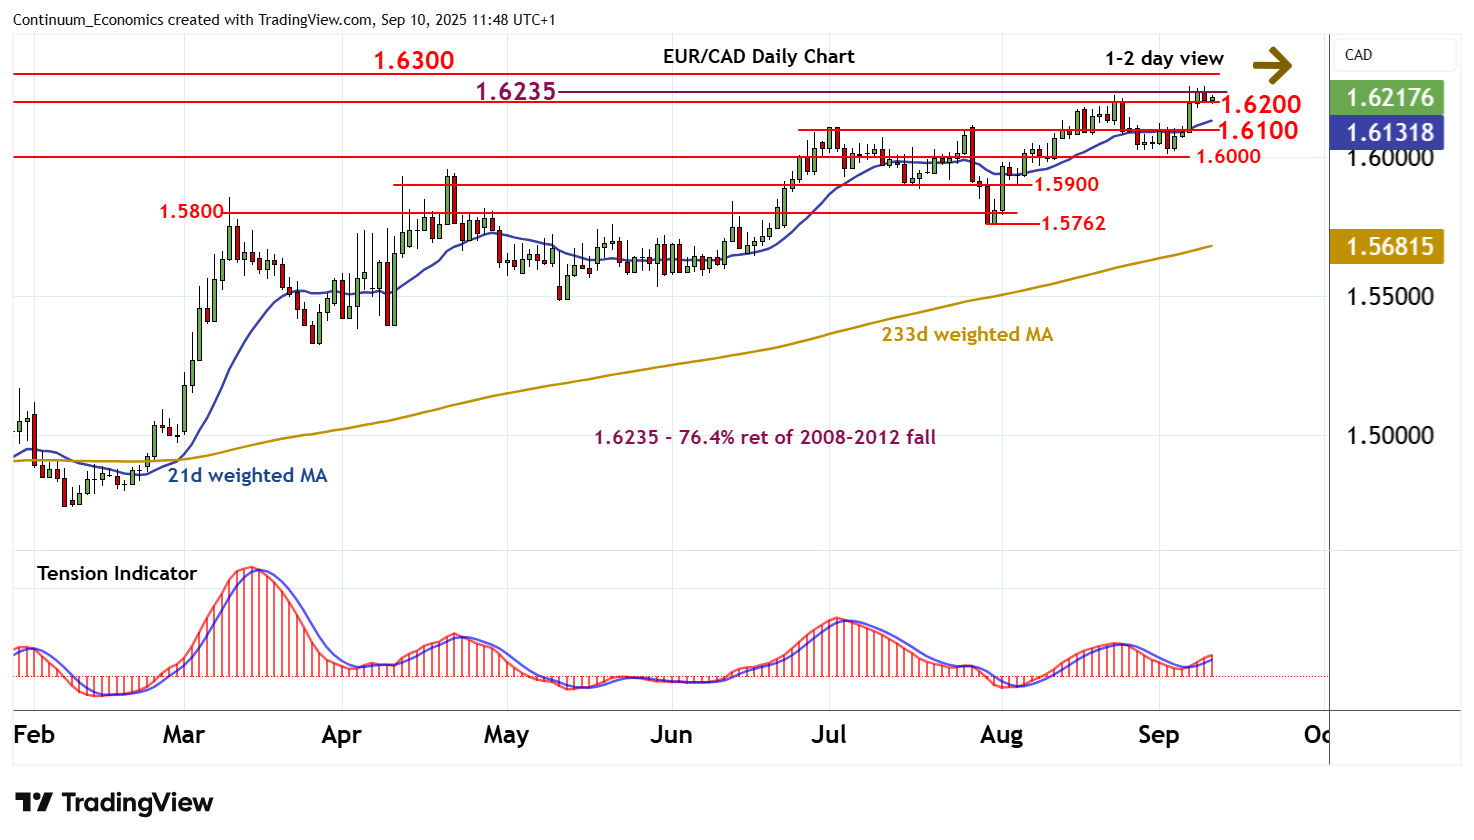
| Level | Comment | Level | Comment | |||||
|---|---|---|---|---|---|---|---|---|
| R4 | 1.6330 | ** | June 2009 high | S1 | 1.6200 | * | congestion | |
| R3 | 1.6300 | * | historic congestion | S2 | 1.6100 | ** | congestion | |
| R2 | 1.6257 | ** | 5 Sep YTD high | S3 | 1.6000 | ** | congestion | |
| R1 | 1.6235 | ** | 76.4% ret of 2008-2012 fall | S4 | 1.5900 | congestion |
Asterisk denotes strength
11:30 BST - Still little change, as prices extend consolidation beneath critical resistance at the 1.6235 multi-year Fibonacci retracement and the 1.6257 current year high of 5 September. Oversold intraday studies are prompting consolidation following the anticipated test of congestion support at 1.6200. But overbought daily stochastics are flattening, suggesting potential for a test beneath here. A break will open up further congestion around 1.6100, where the rising daily Tension Indicator could prompt renewed consolidation. Broader weekly charts are negative, but a further close below 1.6000 is needed to turn sentiment outright negative and confirm a near-term top in place. Meanwhile, a close above 1.6235/57 will turn sentiment positive and extend 2012 gains towards 1.6300/30.