Chartbook: Chart EUR/USD: Corrective pullback into the coming weeks
The anticipated test of strong resistance at congestion around 1.2000 and the 1.2020 multi-year Fibonacci retracement has given way to a sharp pullback from the 1.2080~ current year high of 27 January
The anticipated test of strong resistance at congestion around 1.2000 and the 1.2020 multi-year Fibonacci retracement has given way to a sharp pullback from the 1.2080~ current year high of 27 January, with steady selling interest reaching support at the 1.1390 monthly low of 1 August 2025 before bouncing above 1.1500.
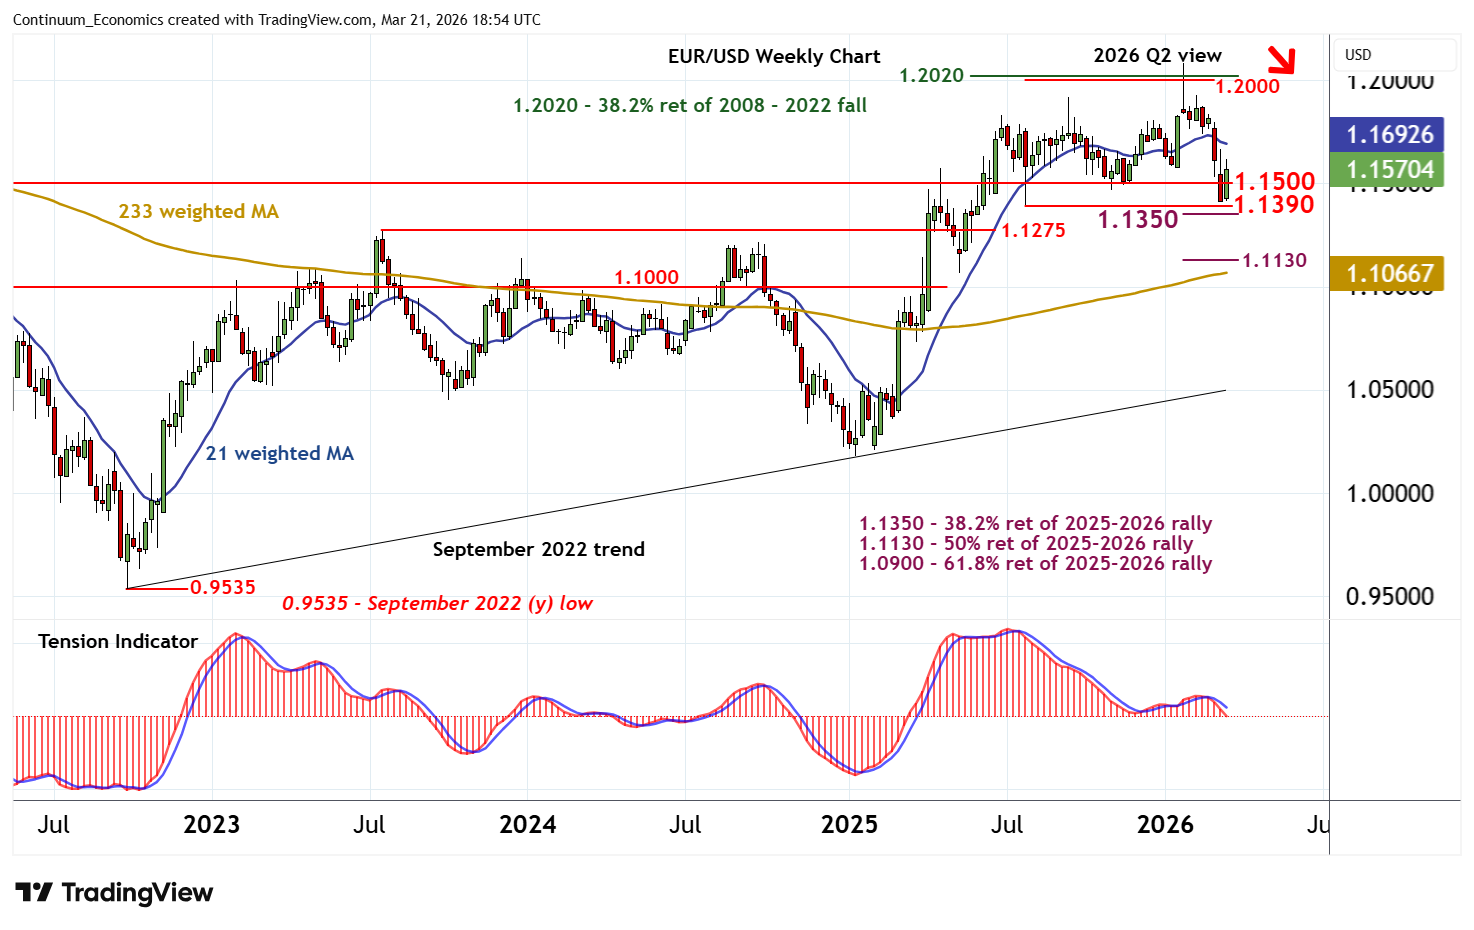
However, weekly stochastics and the weekly Tension Indicator are negative, highlighting room for further losses in the coming weeks.
A close below 1.1390 will add weight to sentiment and extend January losses below the 1.1350 Fibonacci retracement towards the 1.1275 monthly high of July 2023.
Beneath here is the 1.1130 retracement, but by-then oversold weekly stochastics should limit any initial tests in short-covering/consolidation.
Meanwhile, resistance is at congestion around 1.1800 and extends to strong resistance within 1.2000/20
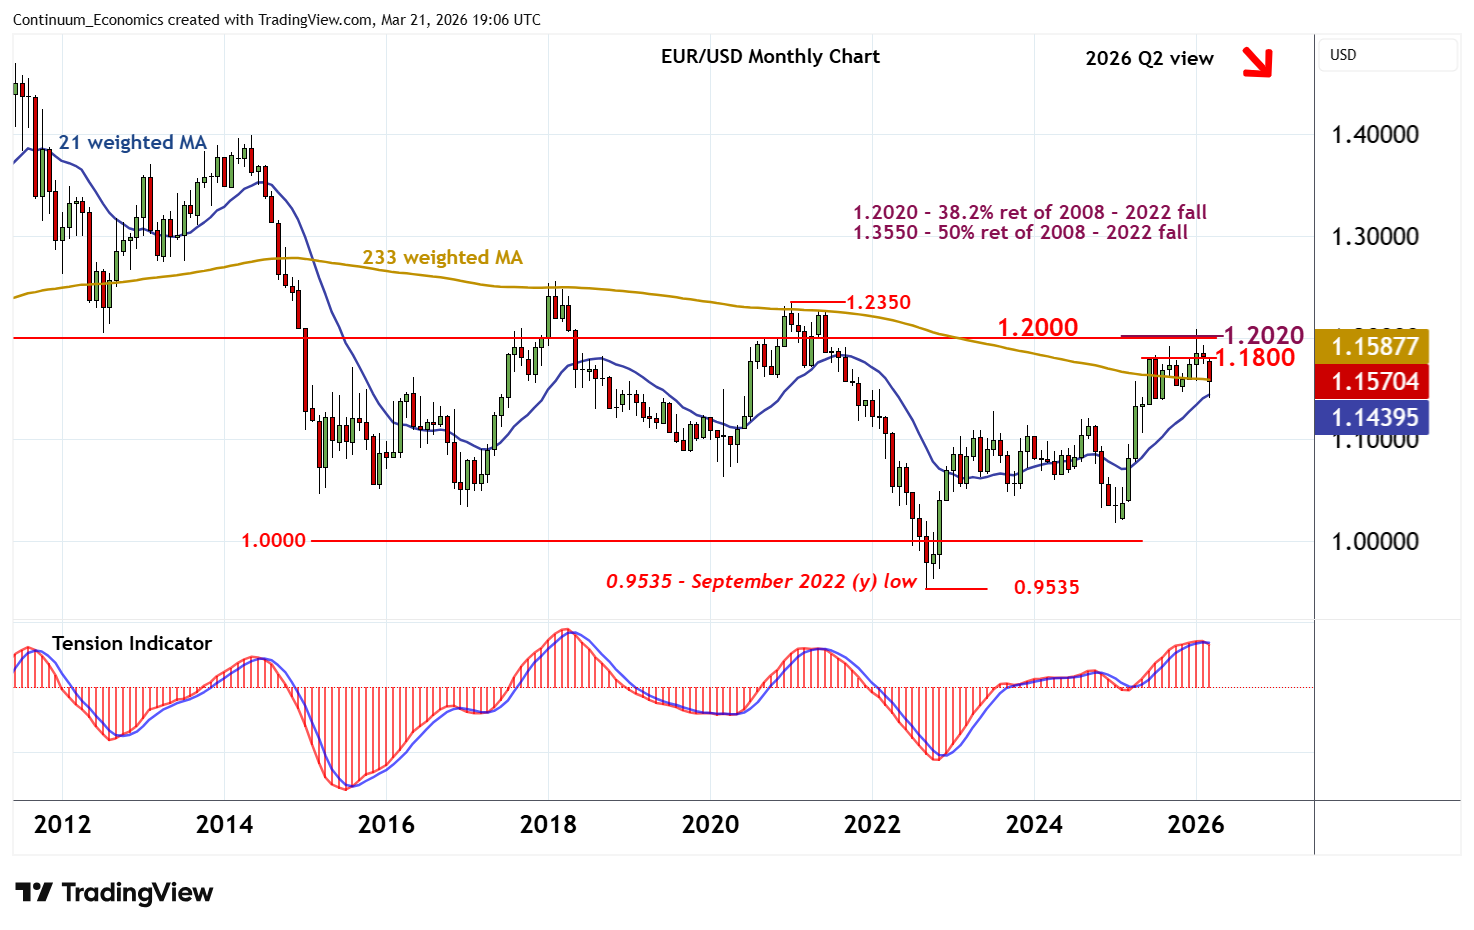
Overbought monthly stochastics are turning down, unwinding negative divergence, and the monthly Tension Indicator is also coming under pressure, highlighting difficulty sustaining any initial tests of this broad 1.1800 - 1.2000/20 range.
But the longer-term, multi-month Tension Indicator is rising,
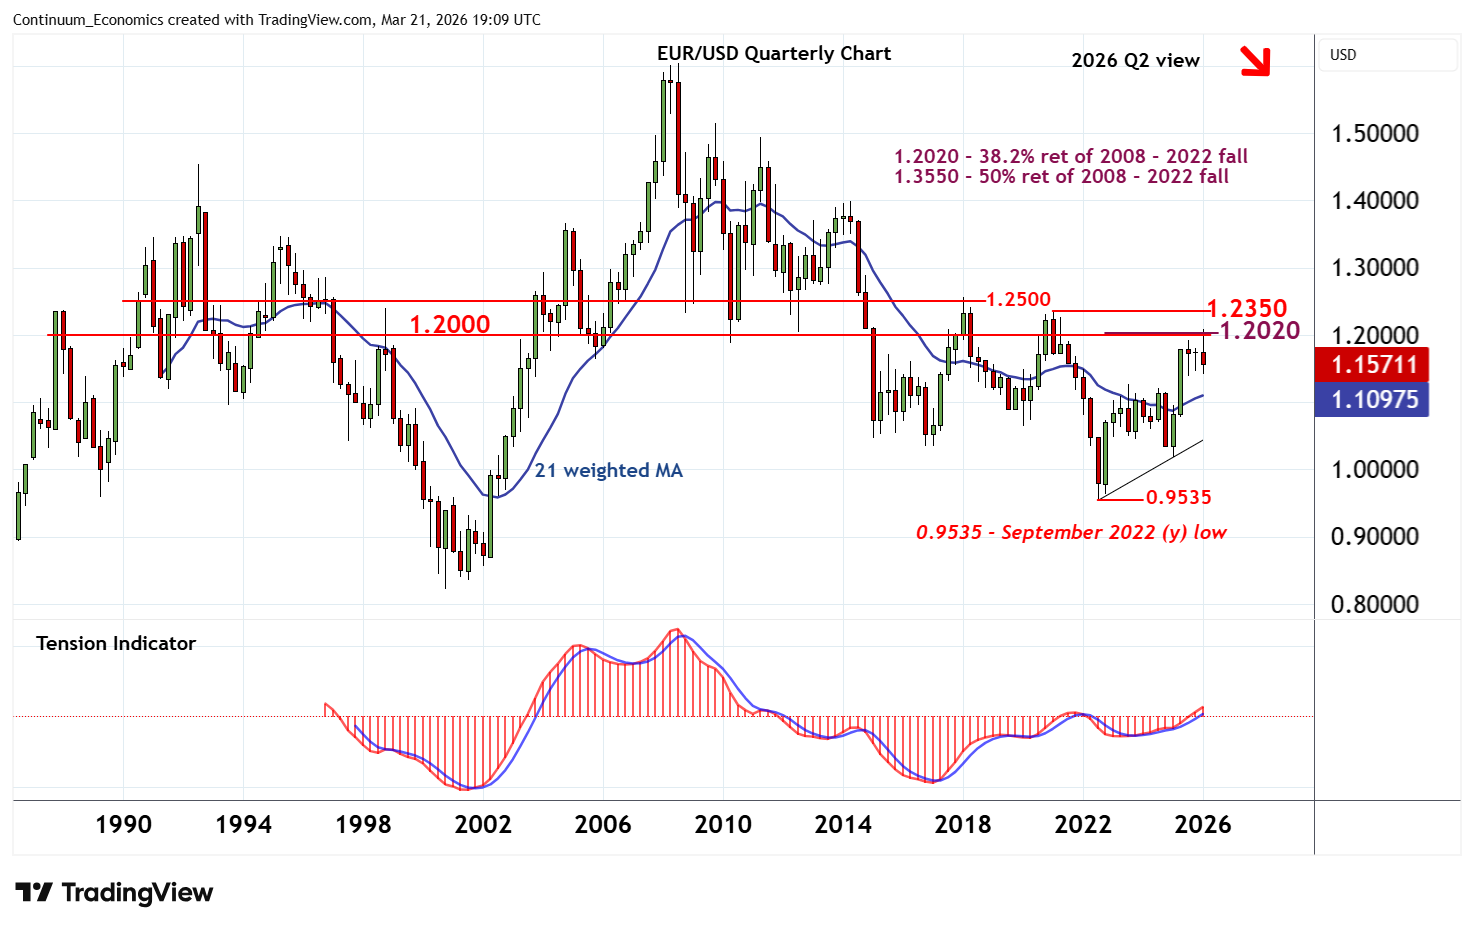
suggesting the current pullback is viewed as a correction within the long-term 2022-2026 bullish trend.
A close above 1.2000/20 would confirm continuation of this 4 year rally, and extend September 2022 gains towards the 1.2350 year high of January 2021.