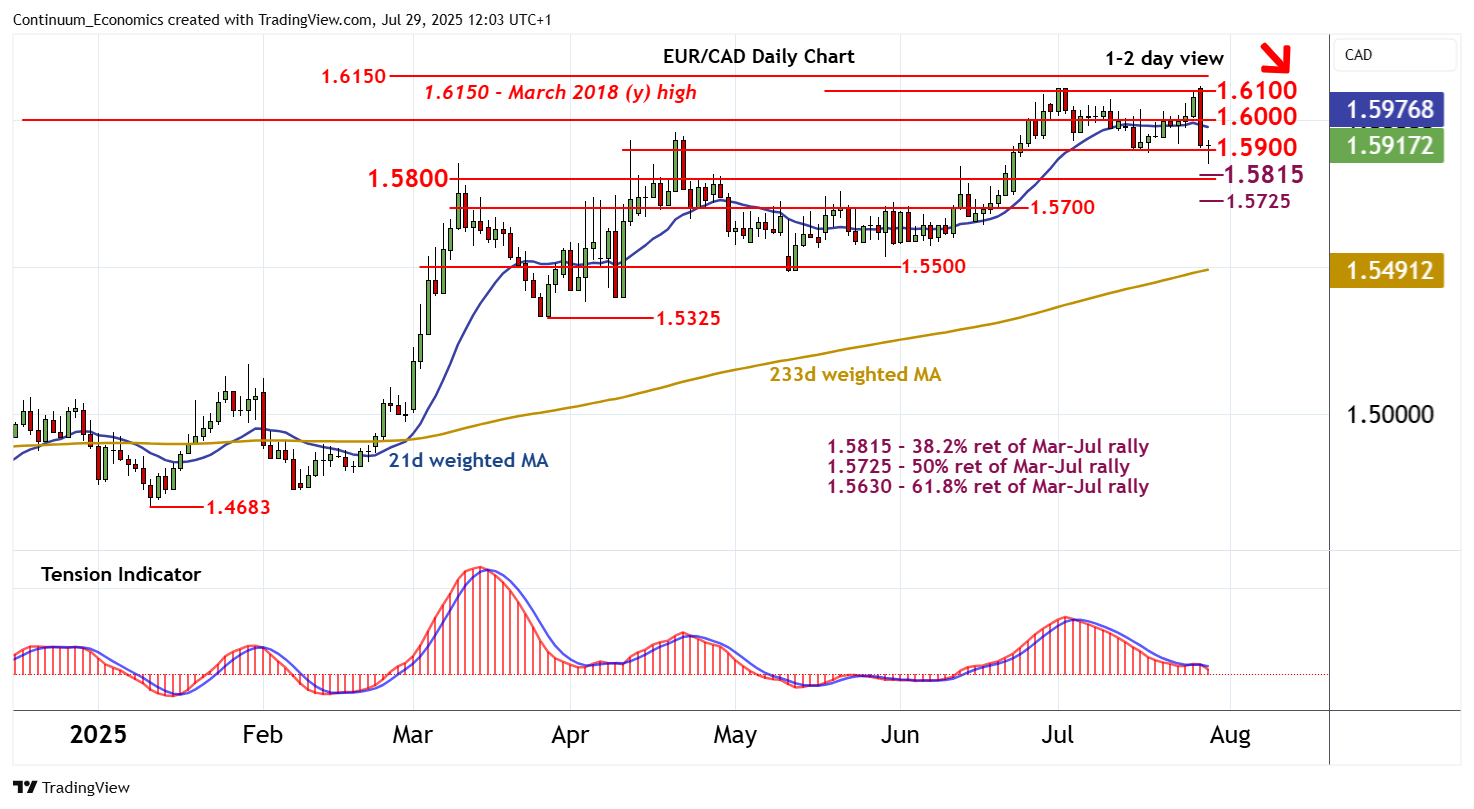
Chart EUR/CAD Update: Pressuring support at 1.5900

Anticipated losses have tested below critical congestion support at 1.5900
| Level | Comment | Level | Comment | |||||
|---|---|---|---|---|---|---|---|---|
| R4 | 1.6200 | historic congestion | S1 | 1.5900 | congestion | |||
| R3 | 1.6150~ | ** | March 2018 (y) high | S2 | 1.5815 | * | 38.2% ret of Mar-Jul rally | |
| R2 | 1.6100/18 | ** | cong; 28 Jul YTD high | S3 | 1.5800 | congestion | ||
| R1 | 1.6000 | ** | congestion | S4 | 1.5725 | * | 50% ret of Mar-Jul rally |
Asterisk denotes strength
11:35 BST - Anticipated losses have tested below critical congestion support at 1.5900, with prices reaching 1.5850~ before bouncing sharply to trade back above 1.5900. Daily readings have turned down and broader weekly charts are also under pressure, highlighting room for fresh losses in the coming sessions. A close below 1.5900 will turn sentiment outright negative and confirm a double top in place around 1.6100, competing a multi-week distribution top as focus then turns initially to the 1.5815 Fibonacci retracement and congestion around 1.5800. Meanwhile, resistance is lowered to congestion around 1.6000 and should cap any immediate tests higher.