Published: 2026-04-20T15:42:00.000Z
Chart USD/CAD Update: Focus on strong support at the 1.3630 Fibonacci retracement
3
The bounce from 1.3650 has met renewed selling interest at 1.3700
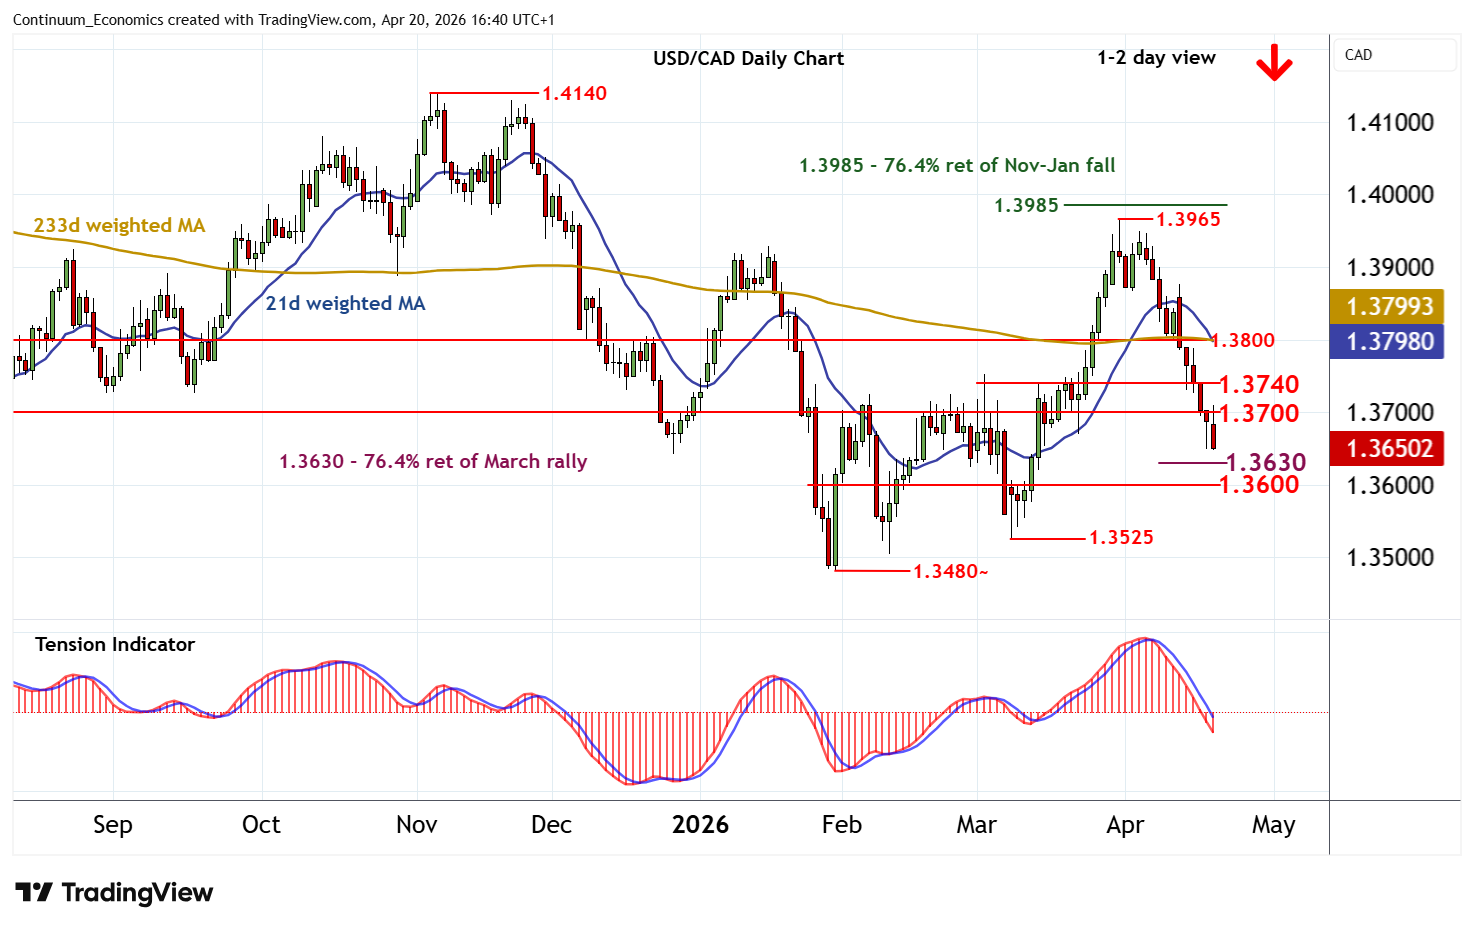
| Levels | Imp | Comment | Levels | Imp | Comment | |||
|---|---|---|---|---|---|---|---|---|
| R4 | 1.3850 | * | congestion | S1 | 1.3650 | * | congestion | |
| R3 | 1.3800 | * | congestion | S2 | 1.3630 | ** | 76.4% ret of March rally | |
| R2 | 1.3740 | * | break level | S3 | 1.3600 | ** | congestion | |
| R1 | 1.3700 | ** | congestion | S4 | 1.3525 | * | 9 Mar (m) low |
Asterisk denotes strength of level
16:20 BST - The bounce from 1.3650 has met renewed selling interest at 1.3700, as overbought intraday studies turn down, with prices once again trading around 1.3650. Daily readings are under pressure and broader weekly charts are bearish, highlighting room for further losses in the coming sessions. Support is at the 1.3630 Fibonacci retracement. Initial tests could give way to consolidation, before fresh selling interest prompt a break and extends late-March losses towards congestion around 1.3600. Meanwhile, a close above 1.3700, if seen, would help to stabilise price action and prompt consolidation beneath the 1.3740 break level.