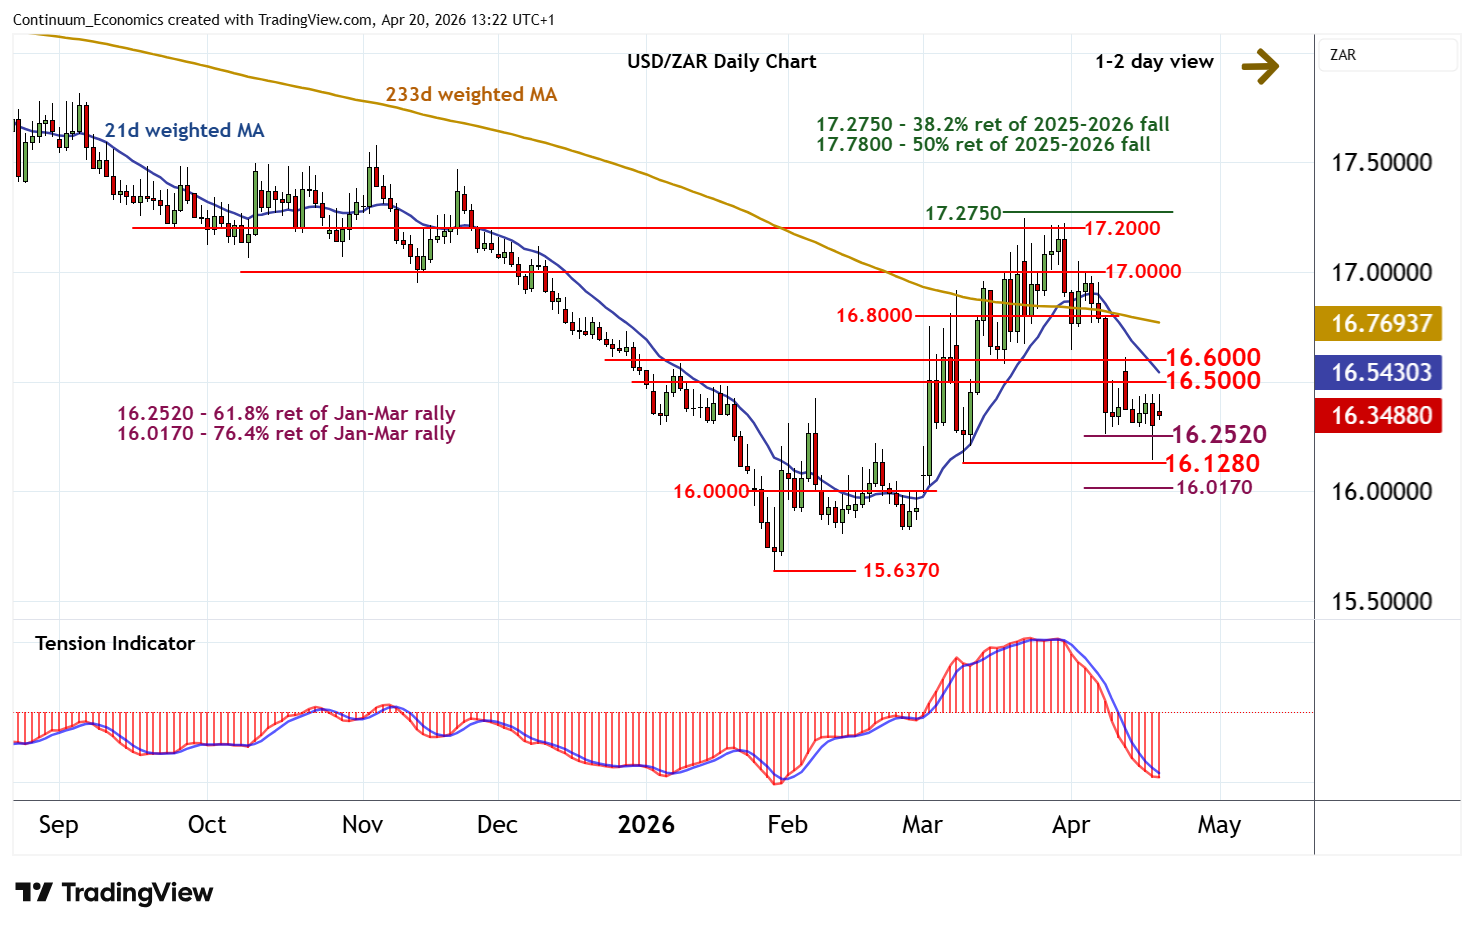
Chart USD/ZAR Update: Back in range following spike lower
The anticipated break below the 16.2520 Fibonacci retracement has bounced smartly from above the 16.1280 weekly low of 10 March
| Level | Comment | Level | Comment | |||||
|---|---|---|---|---|---|---|---|---|
| R4 | 17.0000 | * | congestion | S1 | 16.2520 | ** | 61.8% ret of Jan-Mar rally | |
| R3 | 16.8000 | * | congestion | S2 | 16.1280 | * | 10 Mar (w) low | |
| R2 | 16.6000 | break level | S3 | 16.0170 | ** | 76.4% ret of Jan-Mar rally | ||
| R1 | 16.5000 | break level | S4 | 16.0000 | ** | congestion |
Asterisk denotes strength of level
13:00 BST - The anticipated break below the 16.2520 Fibonacci retracement has bounced smartly from above the 16.1280 weekly low of 10 March, with prices currently balanced around 16.3600. Oversold daily stochastics are edging higher and the bearish daily Tension Indicator is flattening, suggesting room for further tests higher. But negative weekly charts should prompt renewed selling interest interest towards resistance within the 16.5000 - 16.6000 range. Following cautious trade, fresh losses are looked for. However, a close below 16.2520 is needed to turn sentiment negative and extend late-March losses back to 16.1280, ahead of the 16.0170 retracement.