Published: 2025-12-12T00:24:11.000Z
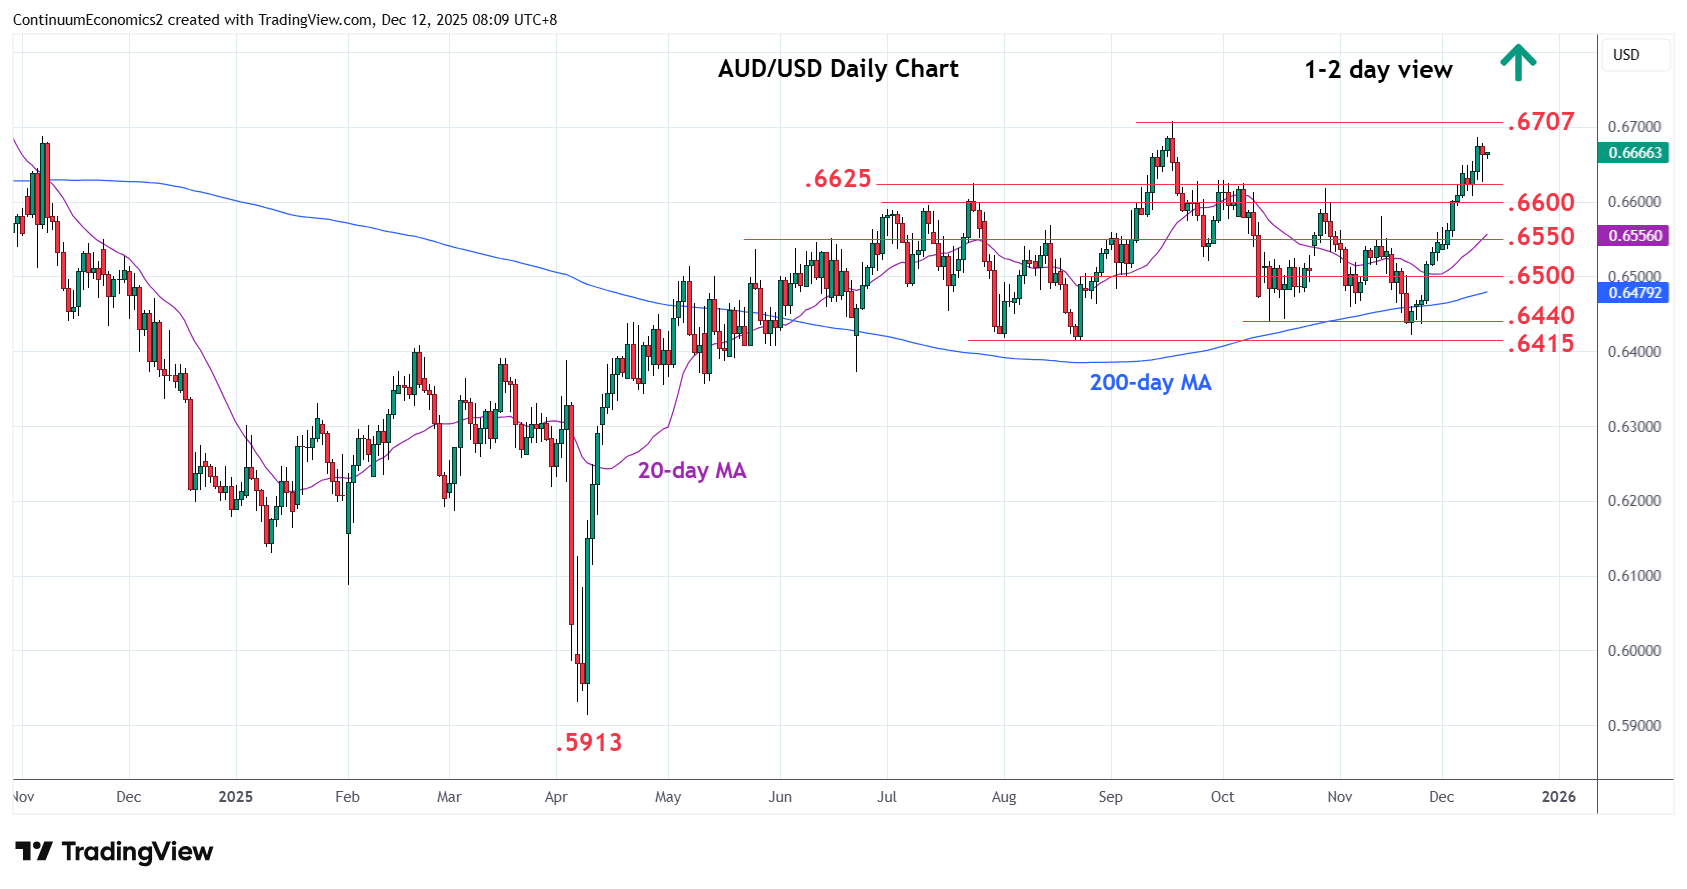
Chart AUD/USD Update: Focus on .6707, YTD high
1
Settled back in consolidation from the .6685 high as prices unwind overbought intraday studies
| Levels | Imp | Comment | Levels | Imp | Comment | |||
|---|---|---|---|---|---|---|---|---|
| R4 | 0.6750/00 | * | congestion | S1 | 0.6625/00 | * | Jul high, congestion | |
| R3 | 0.6710 | * | 38.2% 2021/Apr fall | S2 | 0.6550 | * | congestion | |
| R2 | 0.6700/07 | ** | figure, 17 Sep YTD high | S3 | 0.6500 | * | congestion | |
| R1 | 0.6685 | * | 10 Dec high | S4 | 0.6440/15 | ** | Oct, Aug lows |
Asterisk denotes strength of level
00:10 GMT - Settled back in consolidation from the .6685 high as prices unwind overbought intraday studies. Daily studies are stretched as well and suggest reaction likely on retest of .6707/10, current year high and 38.2% Fibonacci retracement of losses from 2021 year high. However, a later break will see room for extension to the .6750/.6800 congestion area from October 2024. Meanwhile, support at the .6625/00 area should underpin and keep corrective pullback in check. Below this will delay bulls and see deeper consolidation to the .6550 support.