Chart USD/ZAR Update: Sharp break lower
Cautious trade has given way to sharp USD-driven losses
| Level | Comment | Level | Comment | |||||
|---|---|---|---|---|---|---|---|---|
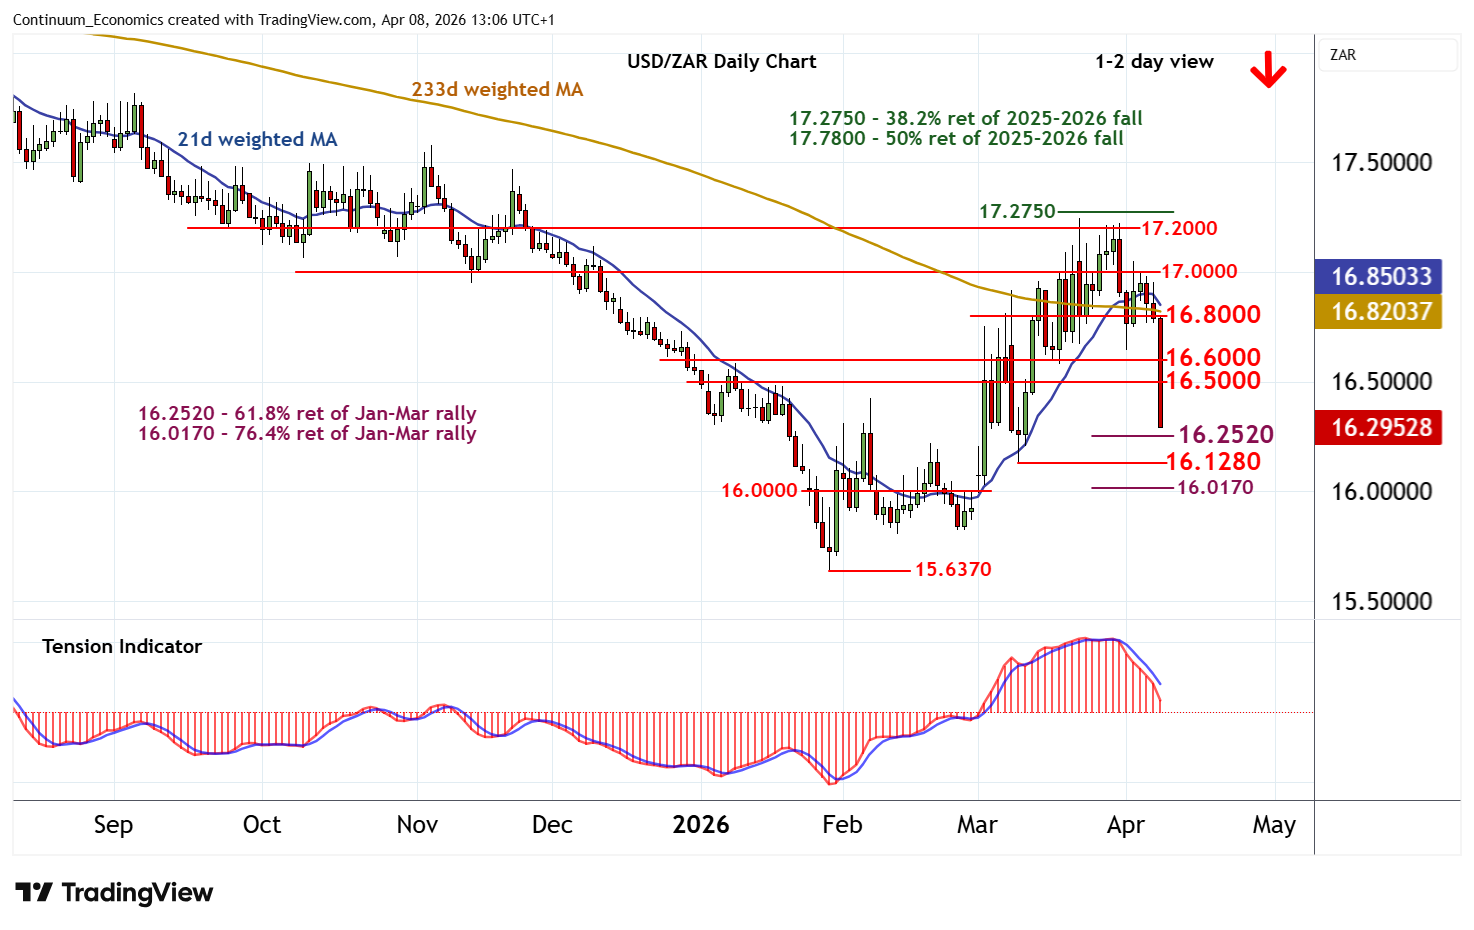
| R4 | 17.0000 | * | congestion | S1 | 16.2520 | ** | 61.8% ret of Jan-Mar rally | |
| R3 | 16.8000 | congestion | S2 | 16.1280 | * | 10 Mar (w) low | ||
| R2 | 16.6000 | break level | S3 | 16.0170 | ** | 76.4% ret of Jan-Mar rally | ||
| R1 | 16.5000 | break level | S4 | 16.0000 | ** | congestion |
Asterisk denotes strength of level
12:45 BST - Cautious trade has given way to sharp USD-driven losses, with prices approaching support at the 16.2520 Fibonacci retracement in heightened volatility. Daily readings are under pressure and overbought weekly stochastics are unwinding, highlighting room for a break beneath here and continuation down to the 16.1280 weekly low of 10 March. However, the rising weekly Tension Indicator and improving longer-term charts should limit any deeper losses in short-covering/consolidation above strong support within the 16.0000 - 16.0170 range. Meanwhile, resistance is lowered to 16.5000 and extends to 16.6000. This range should cap any immediate tests higher.