Published: 2025-12-15T08:10:35.000Z
Chart GBP/JPY Update: Leaning lower in consolidation
-
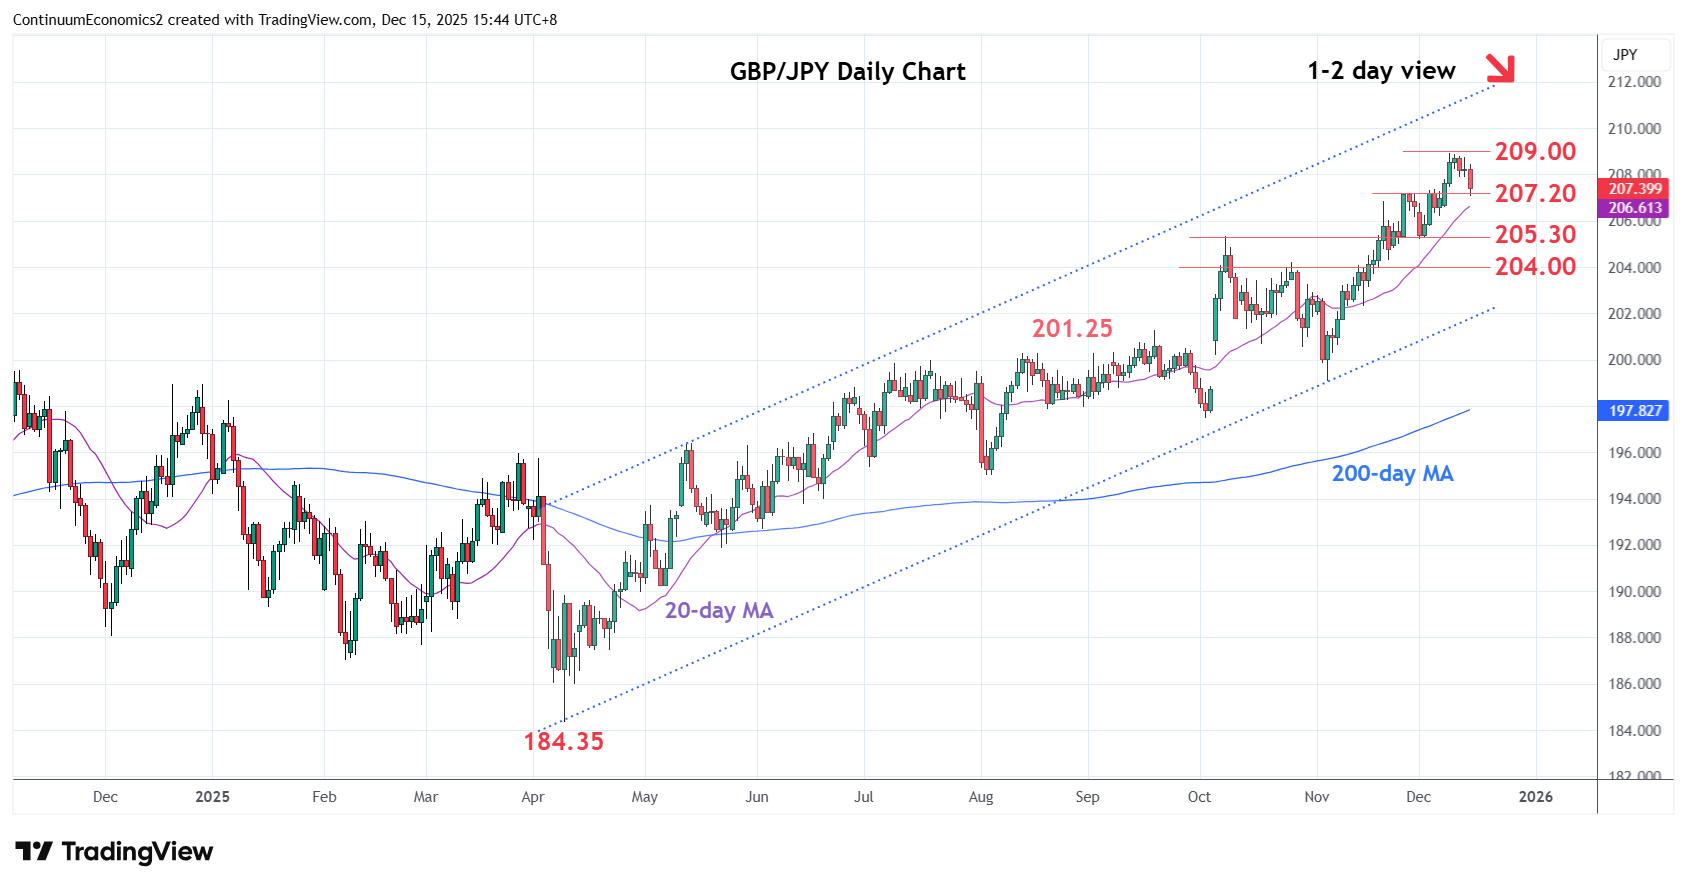
Leaning lower from the 209.00 high of last week as prices unwind overbought intraday and daily studies
| Levels | Imp | Comment | Levels | Imp | Comment | |||
|---|---|---|---|---|---|---|---|---|
| R4 | 214.00/10 | * | congestion, Aug 2008 high | S1 | 207.20 | * | Nov high | |
| R3 | 212.00 | * | congestion | S2 | 206.20/00 | * | congestion | |
| R2 | 210.50 | * | congestion | S3 | 205.30 | ** | Oct high | |
| R1 | 209.00 | ** | 9 Dec YTD high | S4 | 204.00 | ** | congestion |
Asterisk denotes strength of level
08:00 GMT - Leaning lower from the 209.00 high of last week as prices unwind overbought intraday and daily studies to reach support at the 207.20. Would take break here to open up room for deeper correction to retrace gains from the 199.05, November low. Lower will see room to the 206.20/00 congestion then the strong support at 205.30/204.00, October highs. Would take break of the 209.00 high to further extend the underlying bull trend from the 2011 year low to resistance at the 210.50/212.00 congestion and 214.10, August 2008 high.